What is the Automated Drilling Solution
Overview
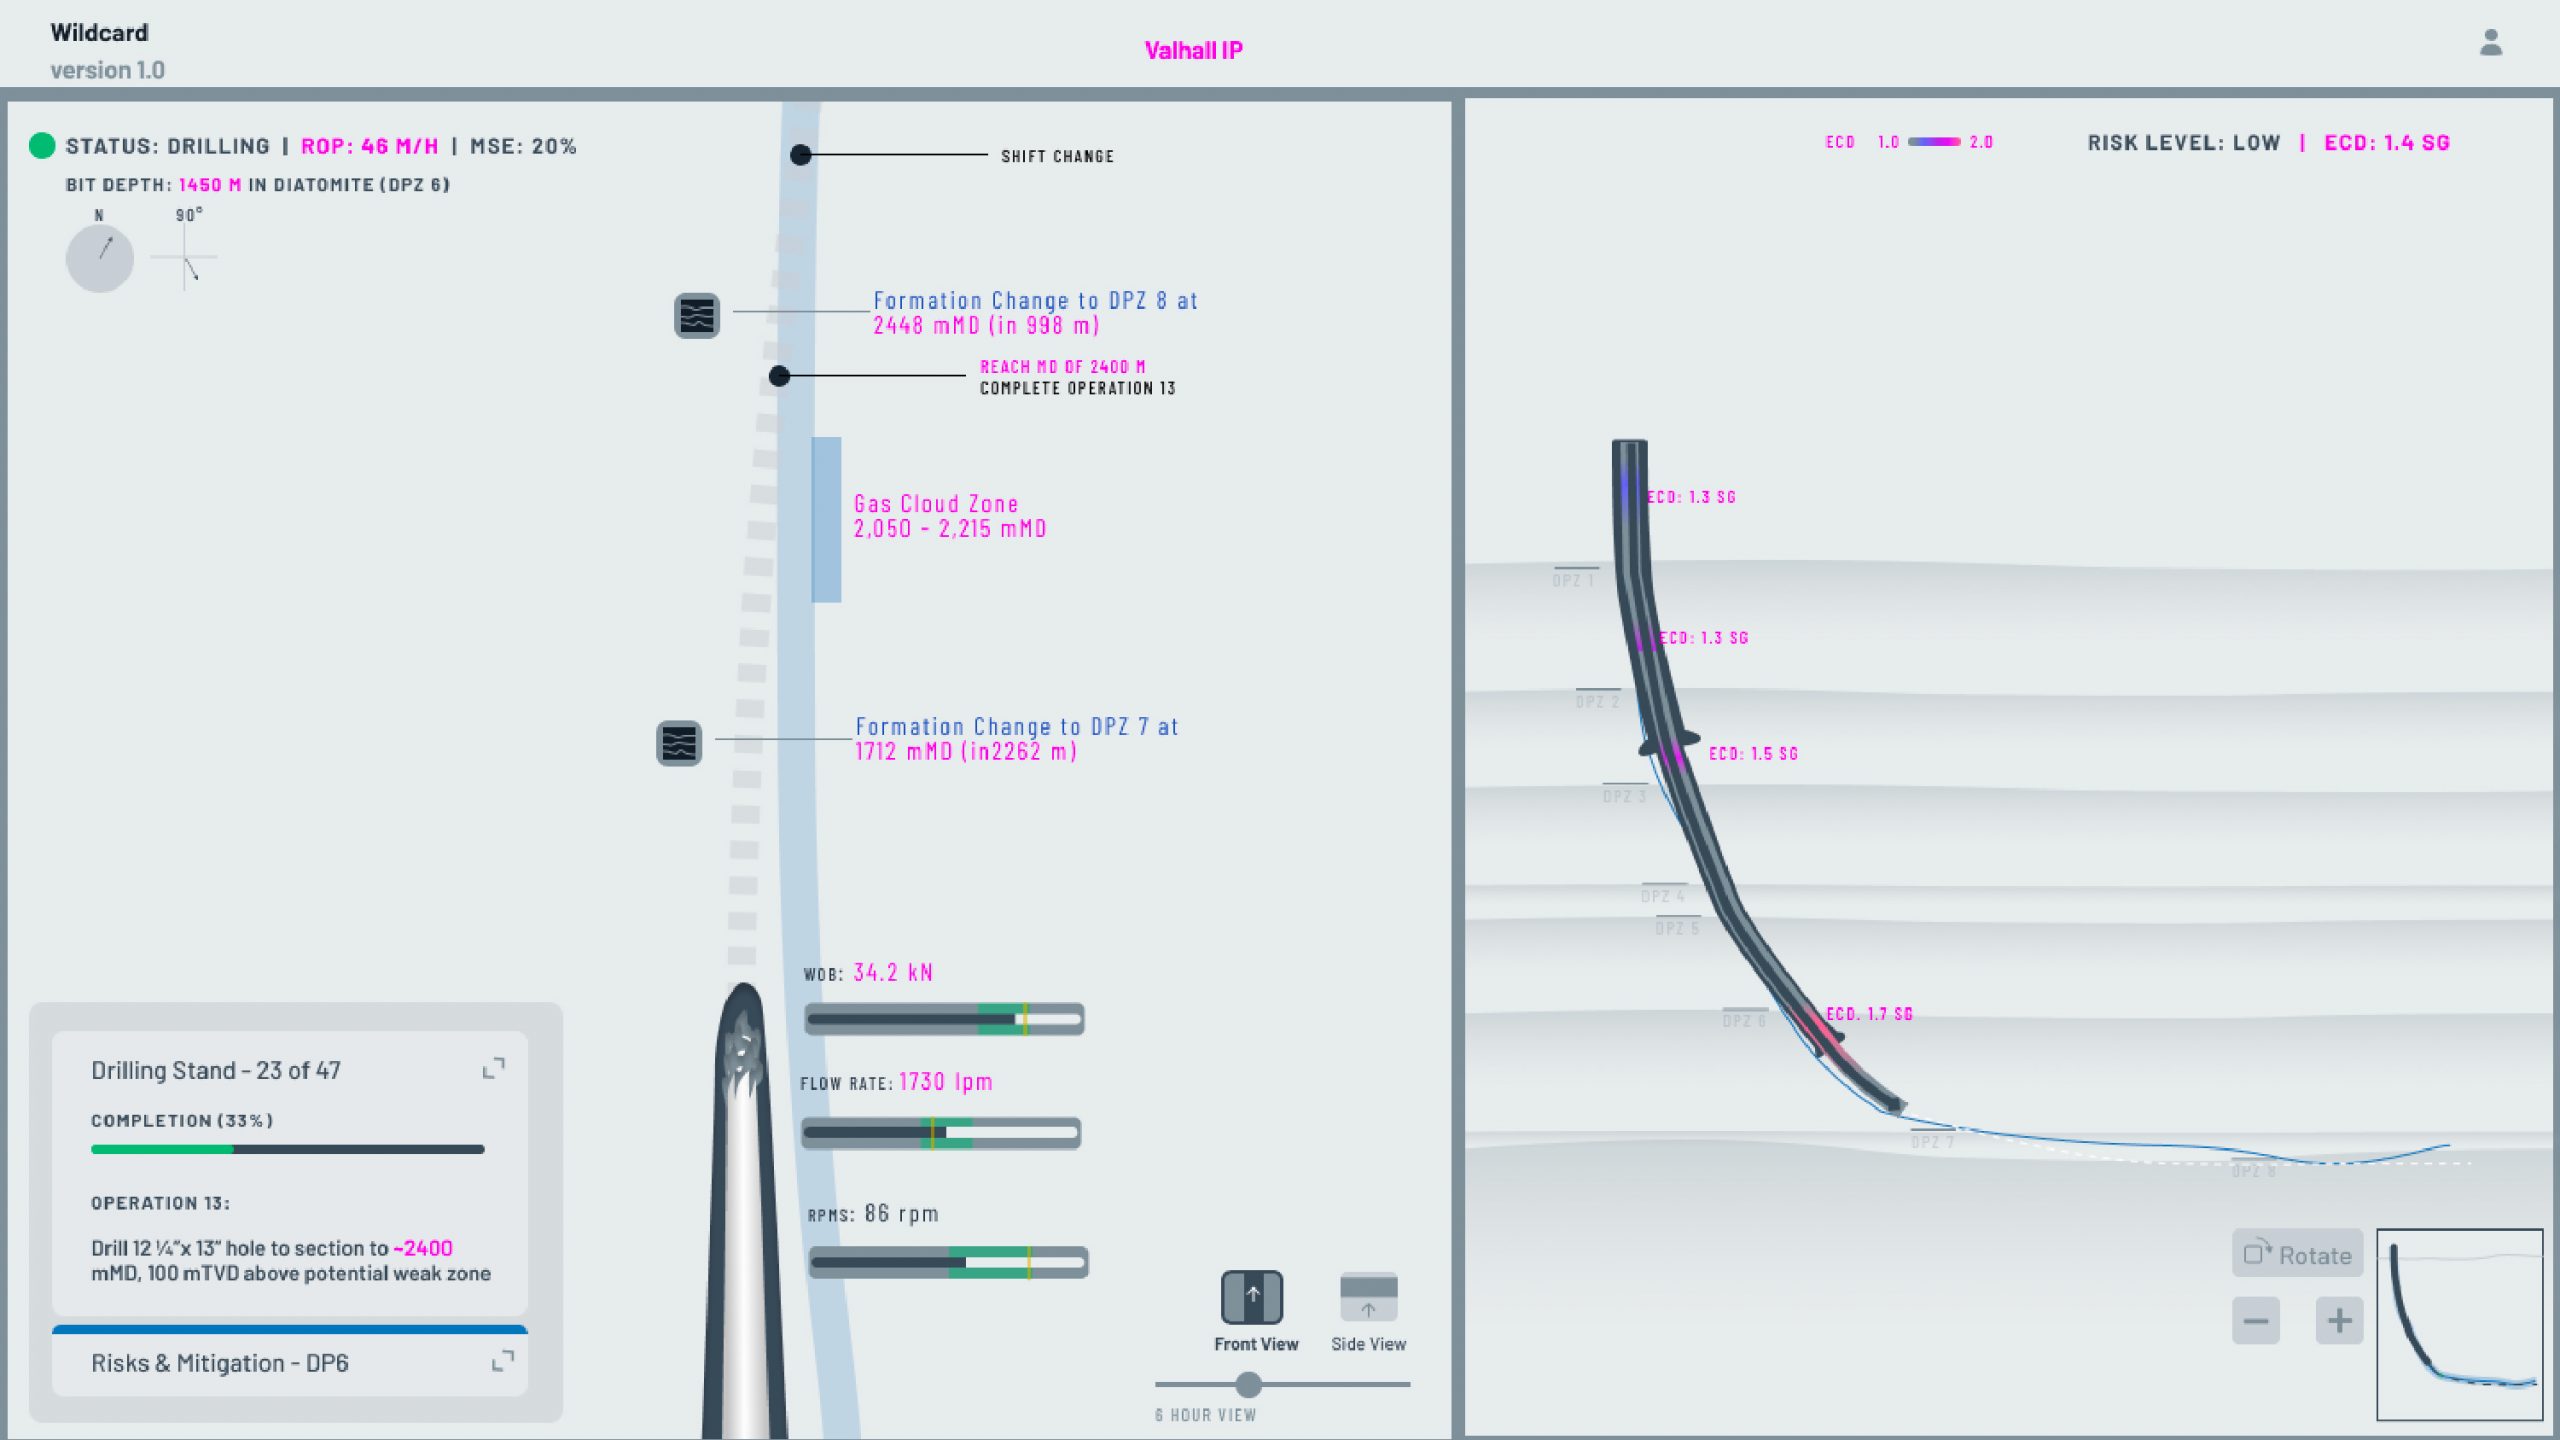
Halliburton real-time operations enables performance improvements at almost every step of the drilling process. Navigating drilling hazards requires ever-increasing levels of vigilance. Intuitive and user-driven, This application is a highly efficient real-time data monitoring application that gives you a consistent view of your drilling data across your operations as it comes in from the rig. It enables you to unlock an immersive real-time environment and collaborate with your team like never before.
Product Requirement Document
Dive deeply with business goals
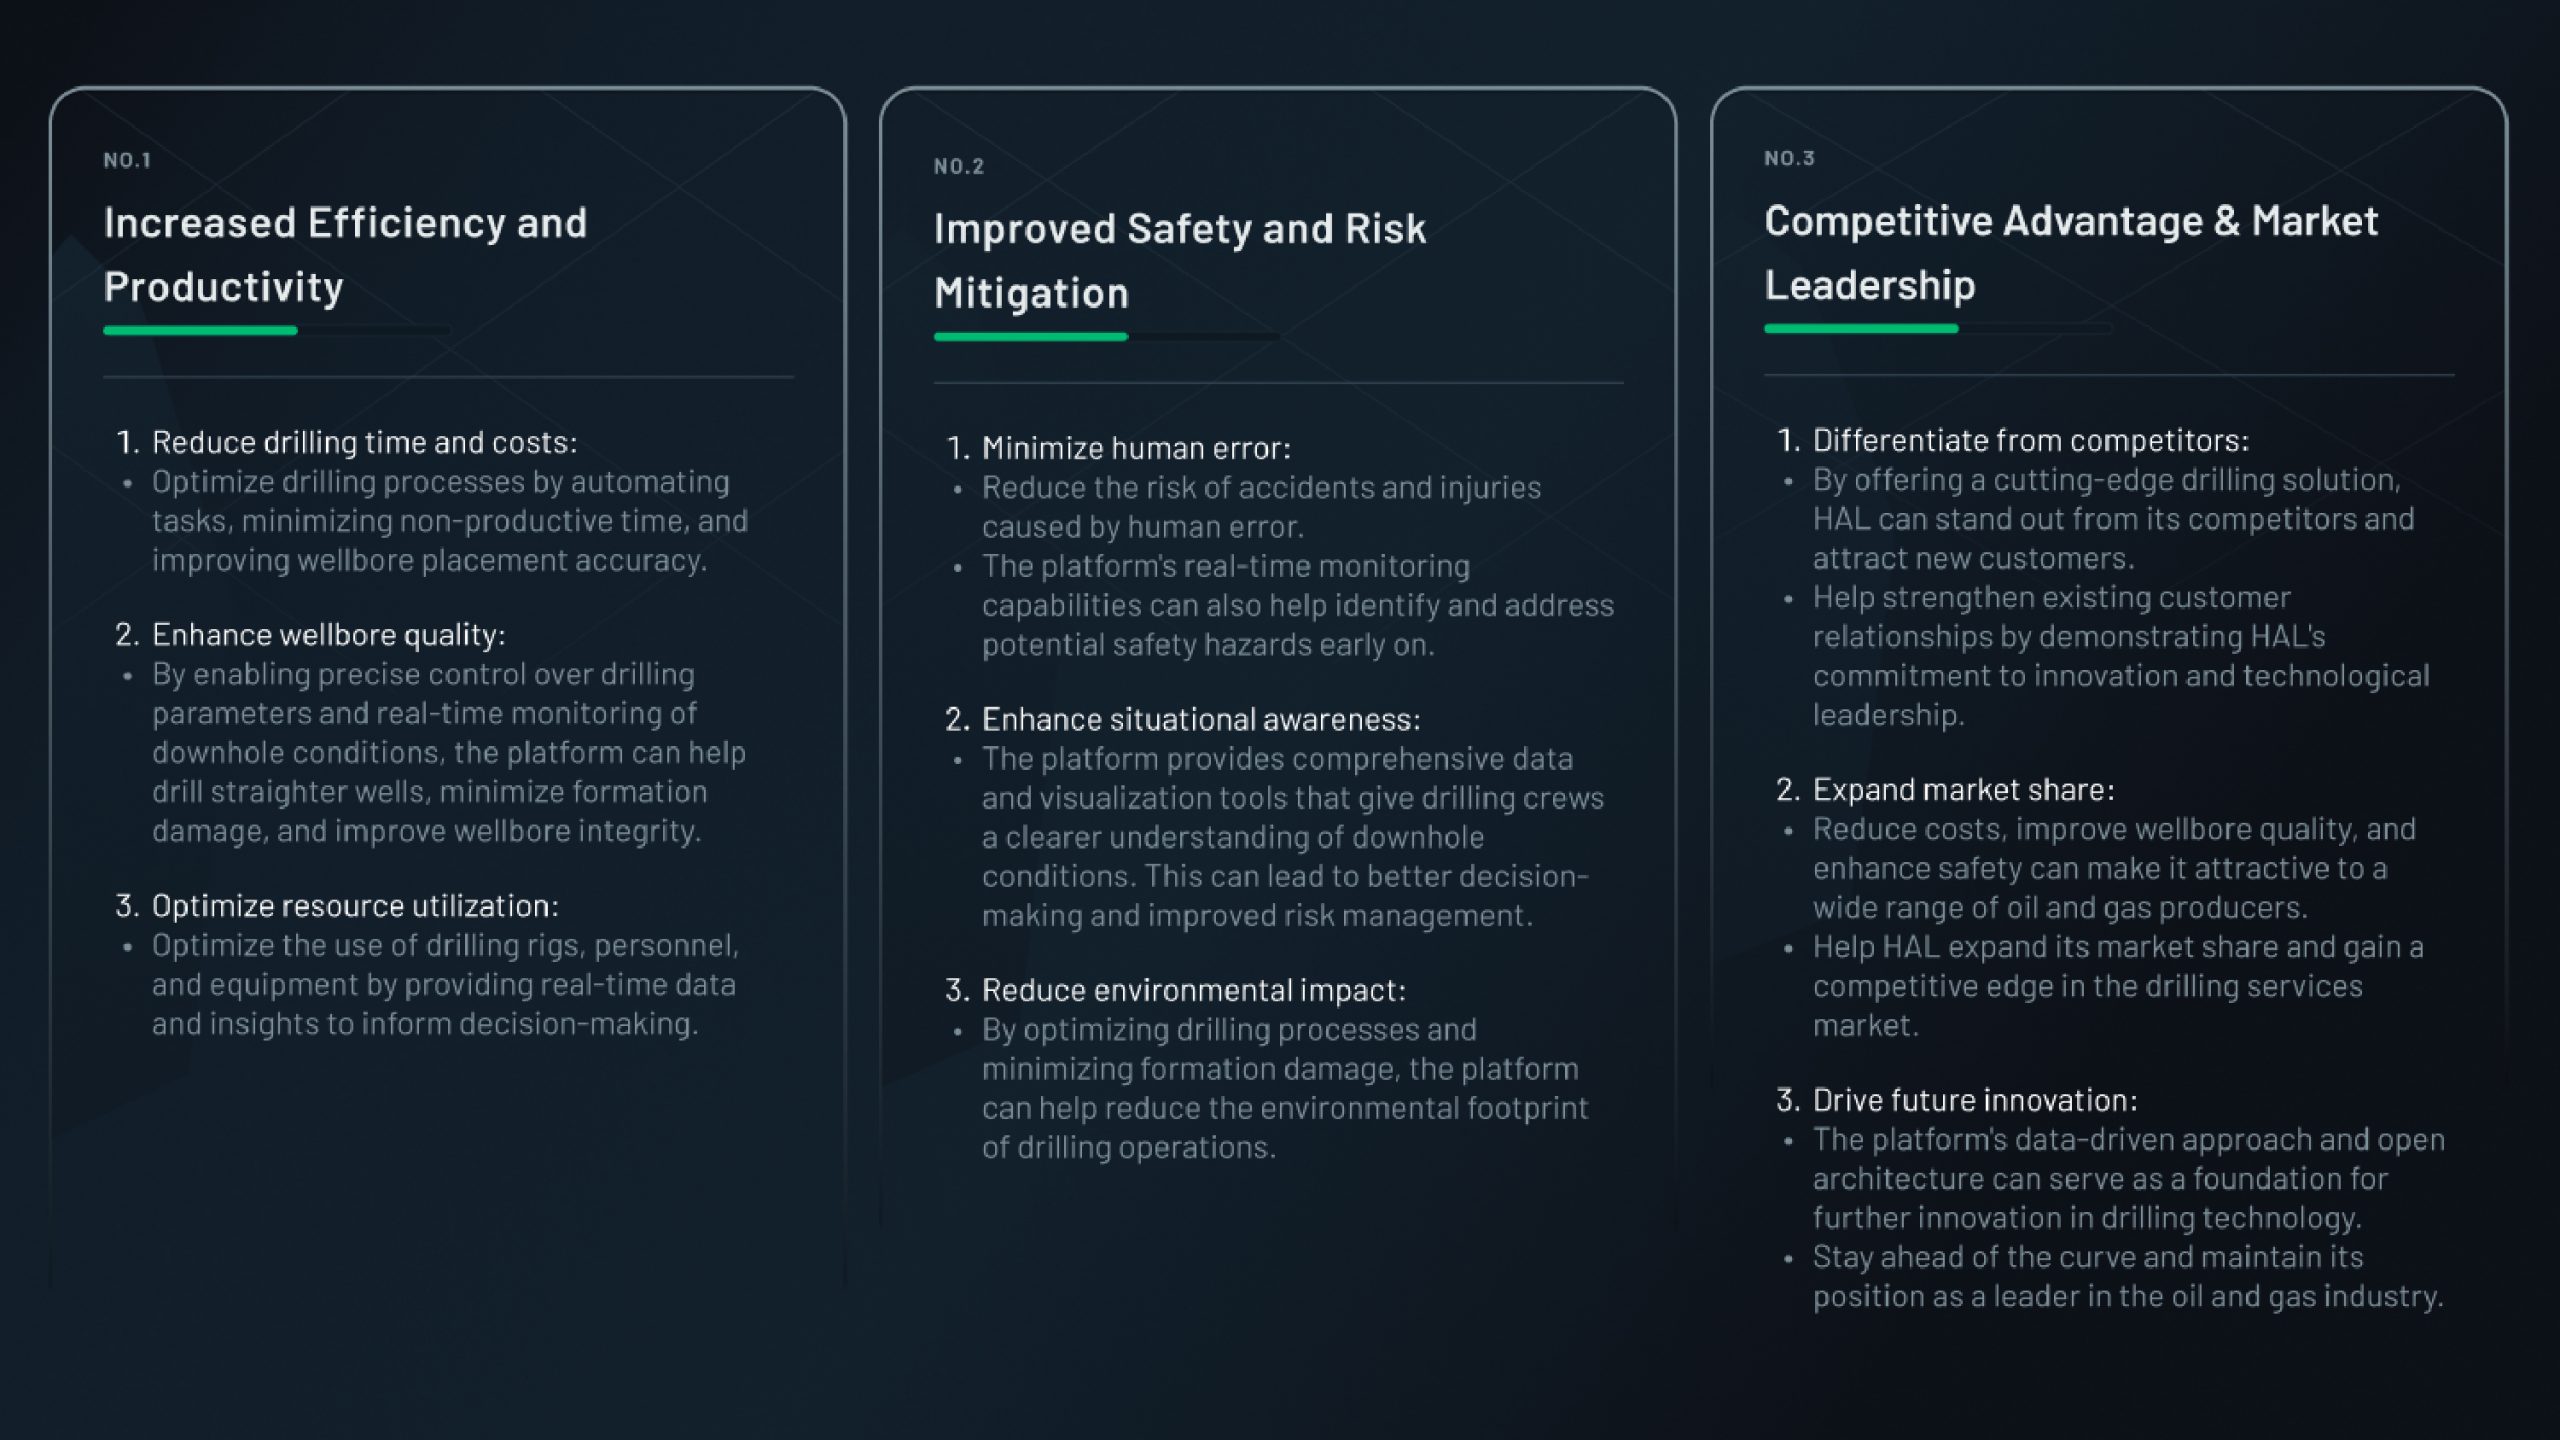
Halliburton’s 3D Automated Drilling Solution Platform is a complex and innovative technology with the potential to revolutionize the oil and gas drilling industry. Its business goals can be categorized into three main areas:
Production at HAL
Desired Product Outcomes
⏱ Decision-making speed increased by 35–50%
Real-time 3D visibility reduced time to interpret downhole conditions from minutes to seconds, enabling faster and more confident operational decisions.
🎯 Situational awareness accuracy improved by 25–30%
Integrated spatial and operational data eliminated reliance on mental 2D-to-3D mapping, significantly reducing misinterpretation risks.
⚙️ Operational efficiency improved by 20–30%
Automation of data aggregation and visualization reduced manual monitoring and cross-referencing tasks, allowing engineers to focus on critical decisions.
💰 Potential reduction in Non-Productive Time (NPT) by 10–15%
Faster detection of drilling anomalies enabled earlier intervention, minimizing costly downtime (estimated savings: $50K–$200K per incident).
🤝 Cross-team collaboration efficiency increased by ~30%
A shared real-time 3D interface aligned field and remote teams, reducing communication delays and misalignment during critical operations.
🛡 Risk detection and mitigation improved by 20–25%
Early visualization of potential hazards (trajectory deviation, pressure anomalies) enabled proactive intervention and safer drilling operations.
😊 User satisfaction increased by 30%+ (post-test feedback)
Engineers reported higher confidence, reduced frustration, and improved usability, driving stronger adoption and engagement.
UI/UX Challenges
Understand clearly
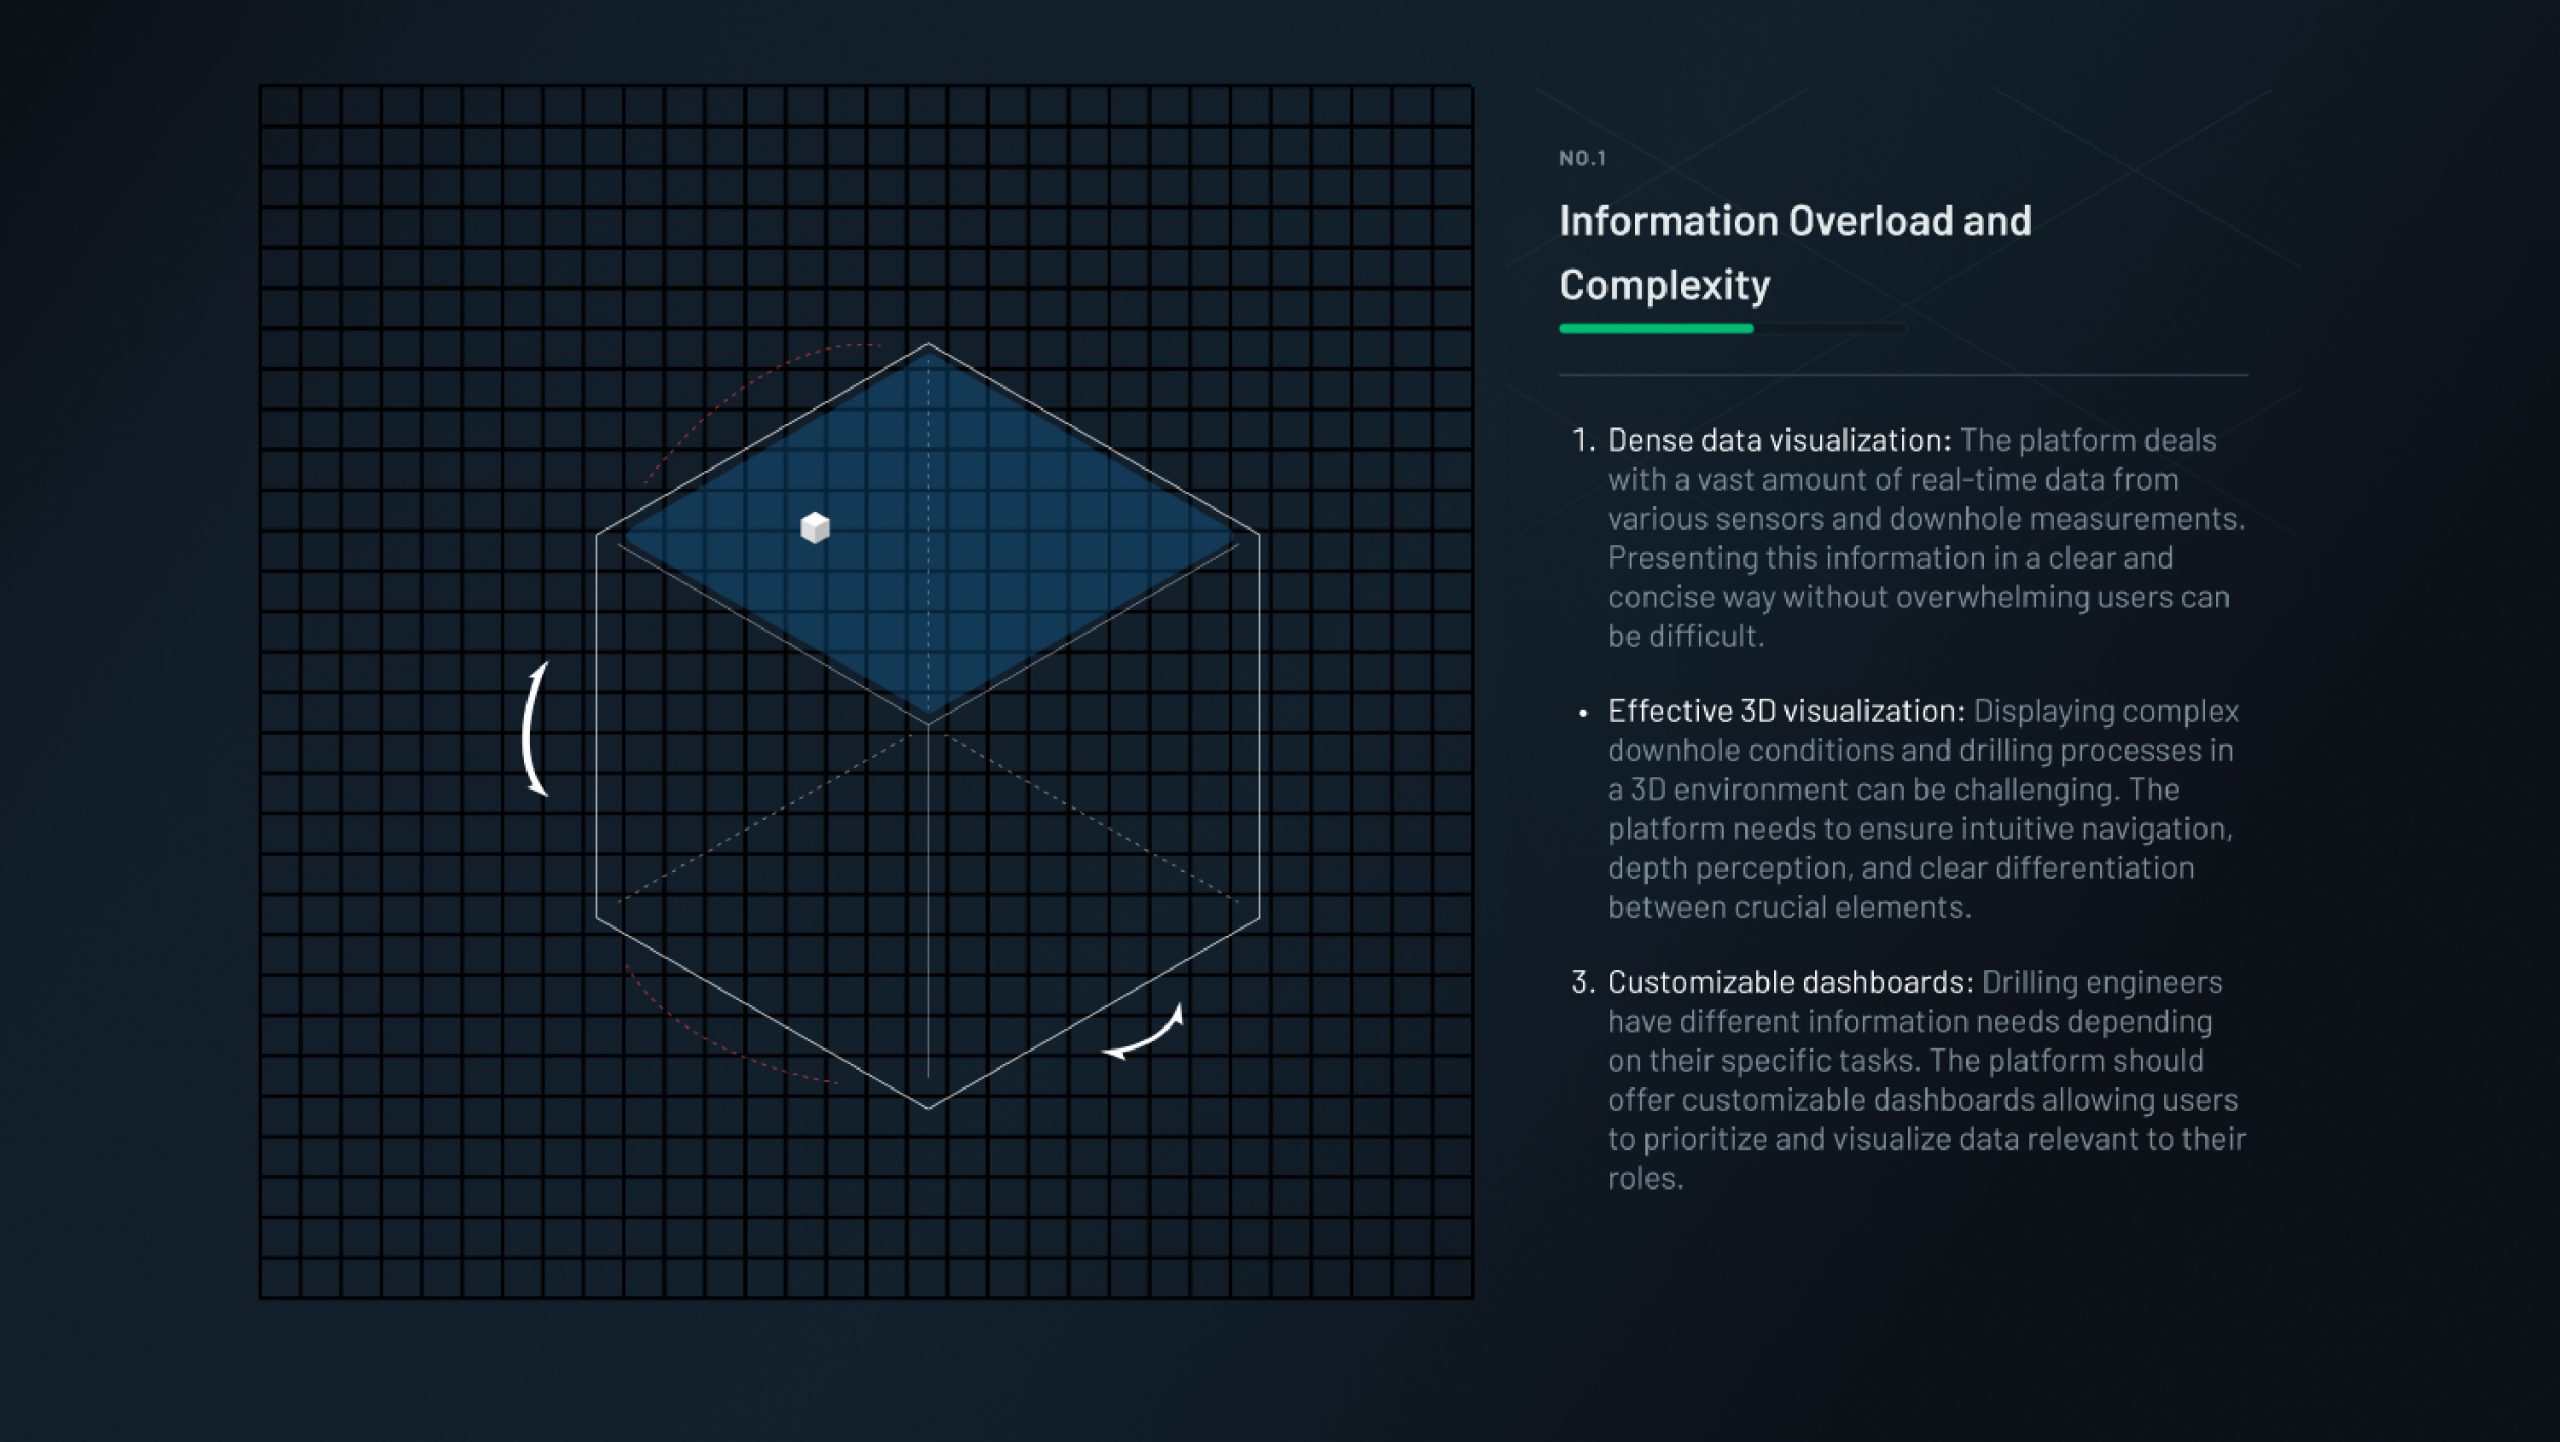
HAL Platform is a powerful tool with immense potential, but it also faces significant UI/UX challenges due to its complex nature and target audience. Here are some key issues to consider:
How to research
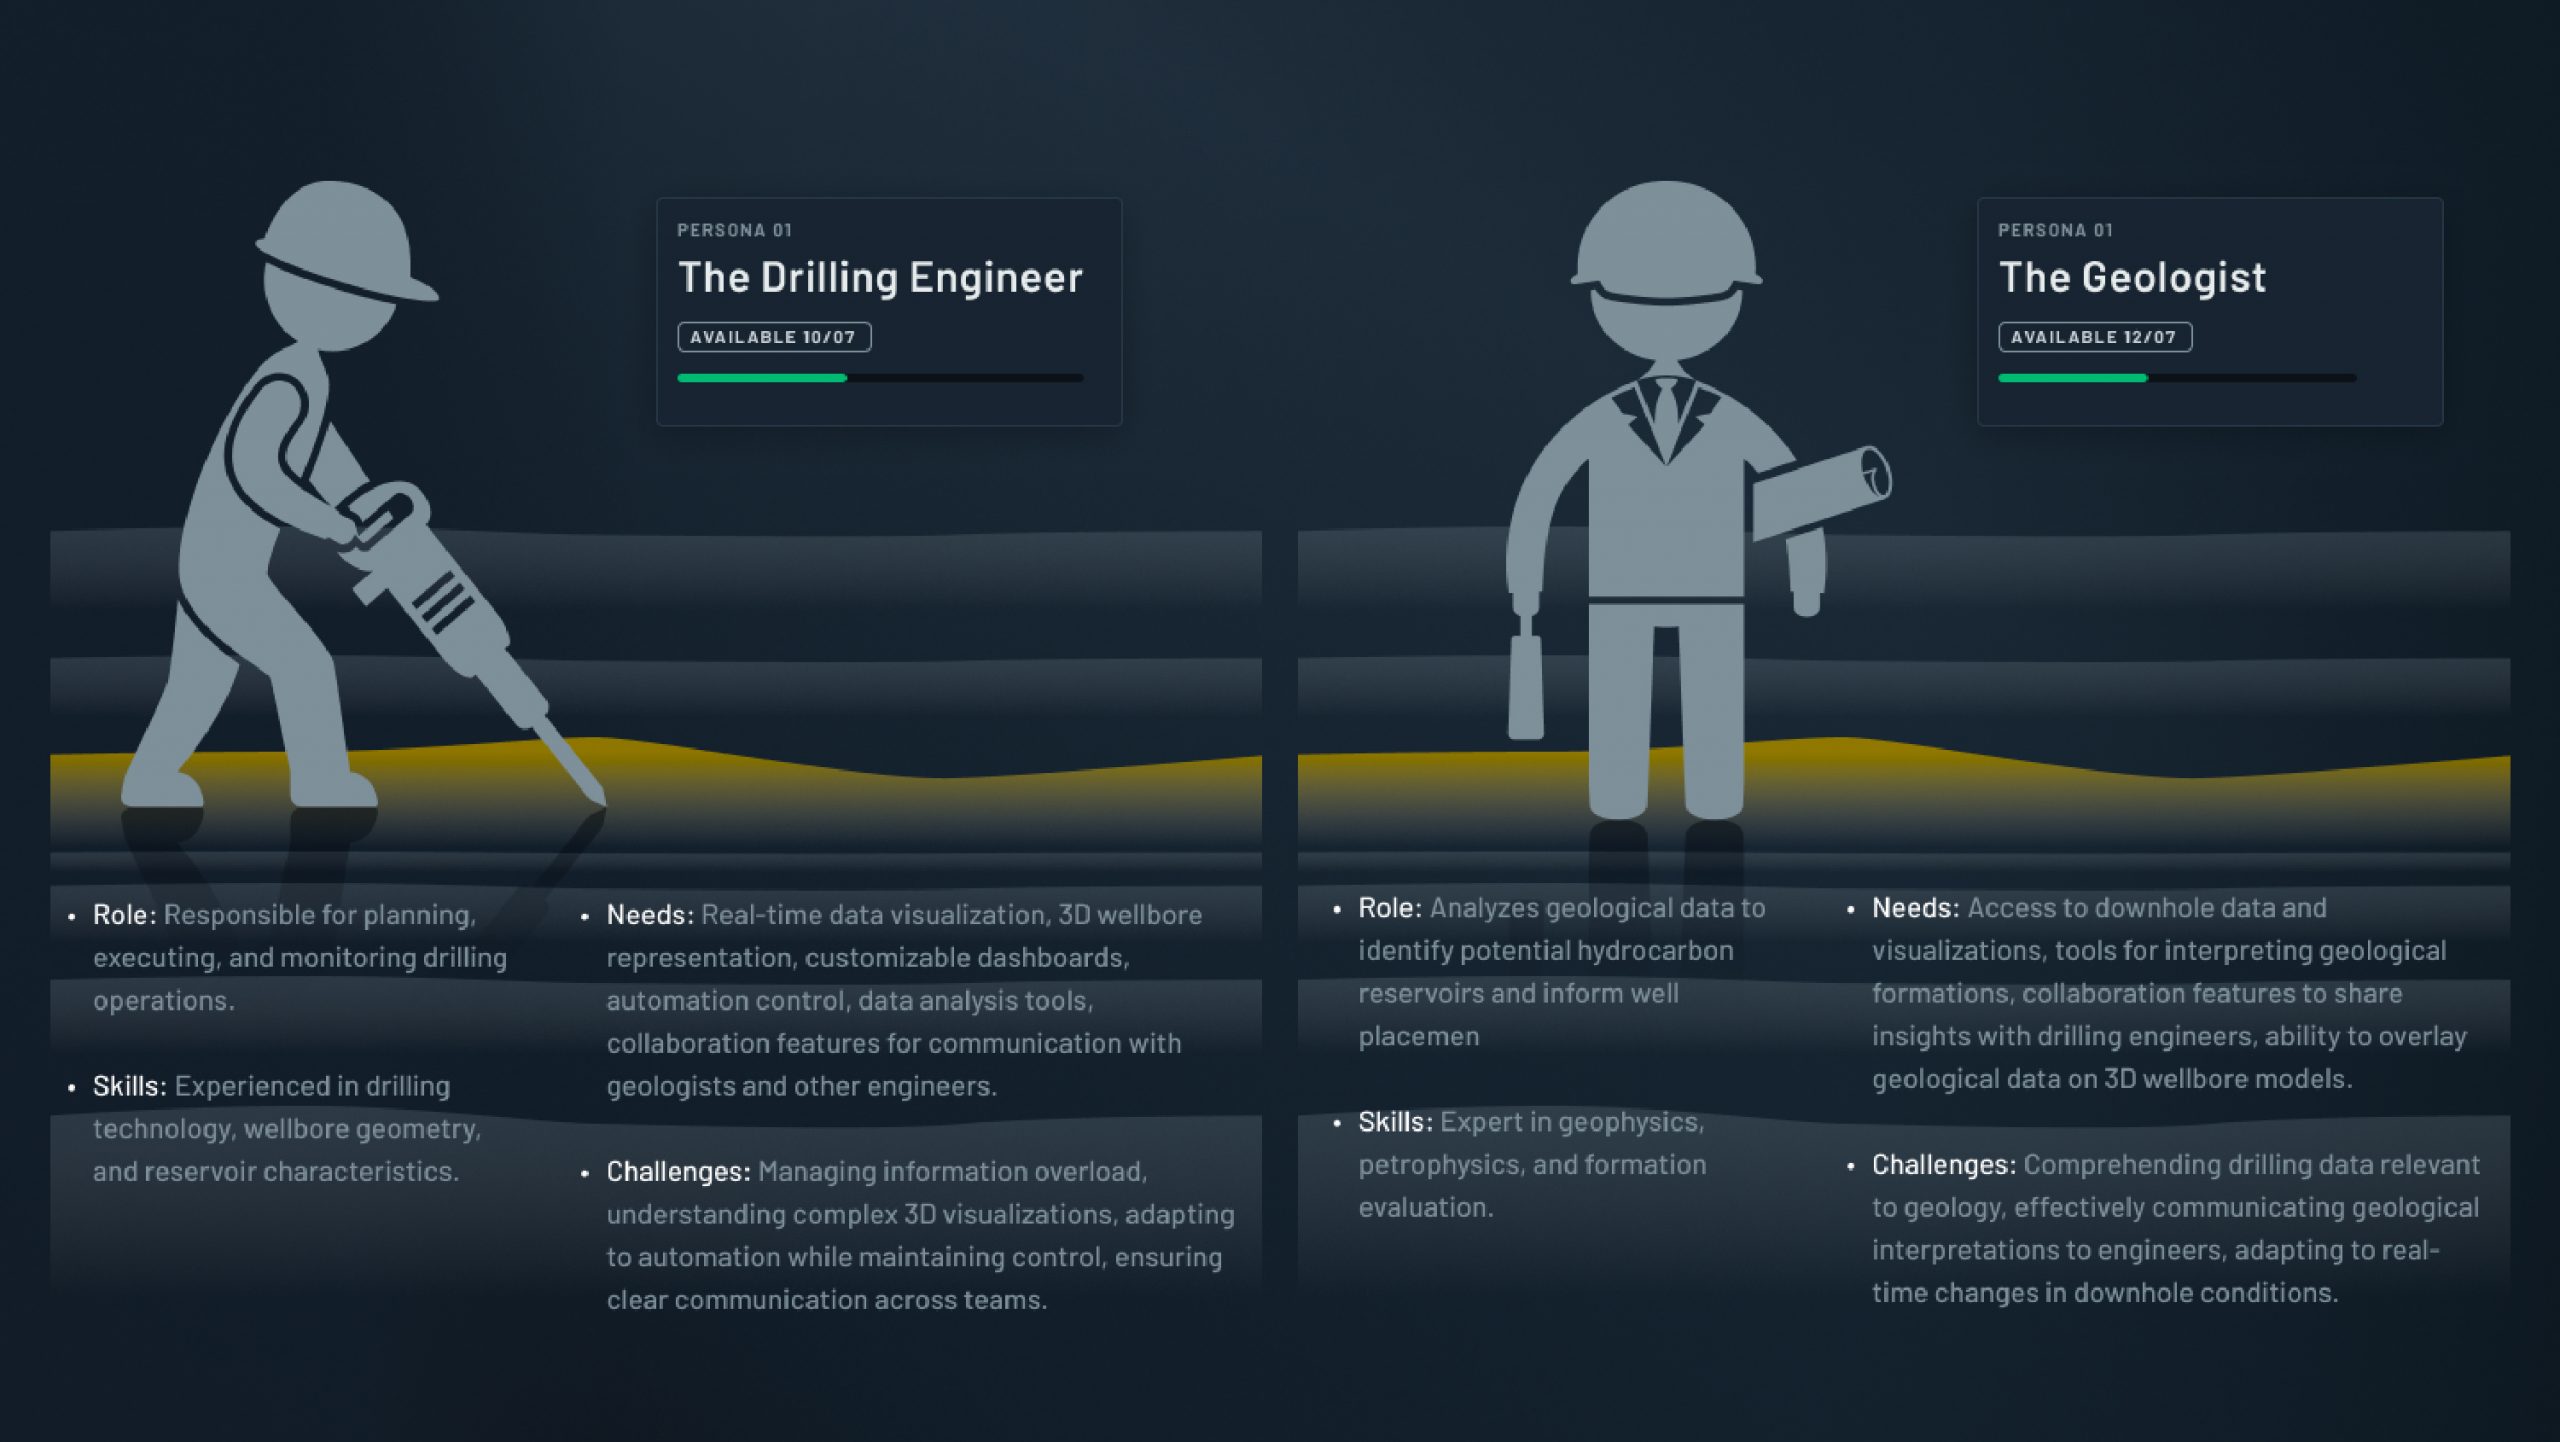
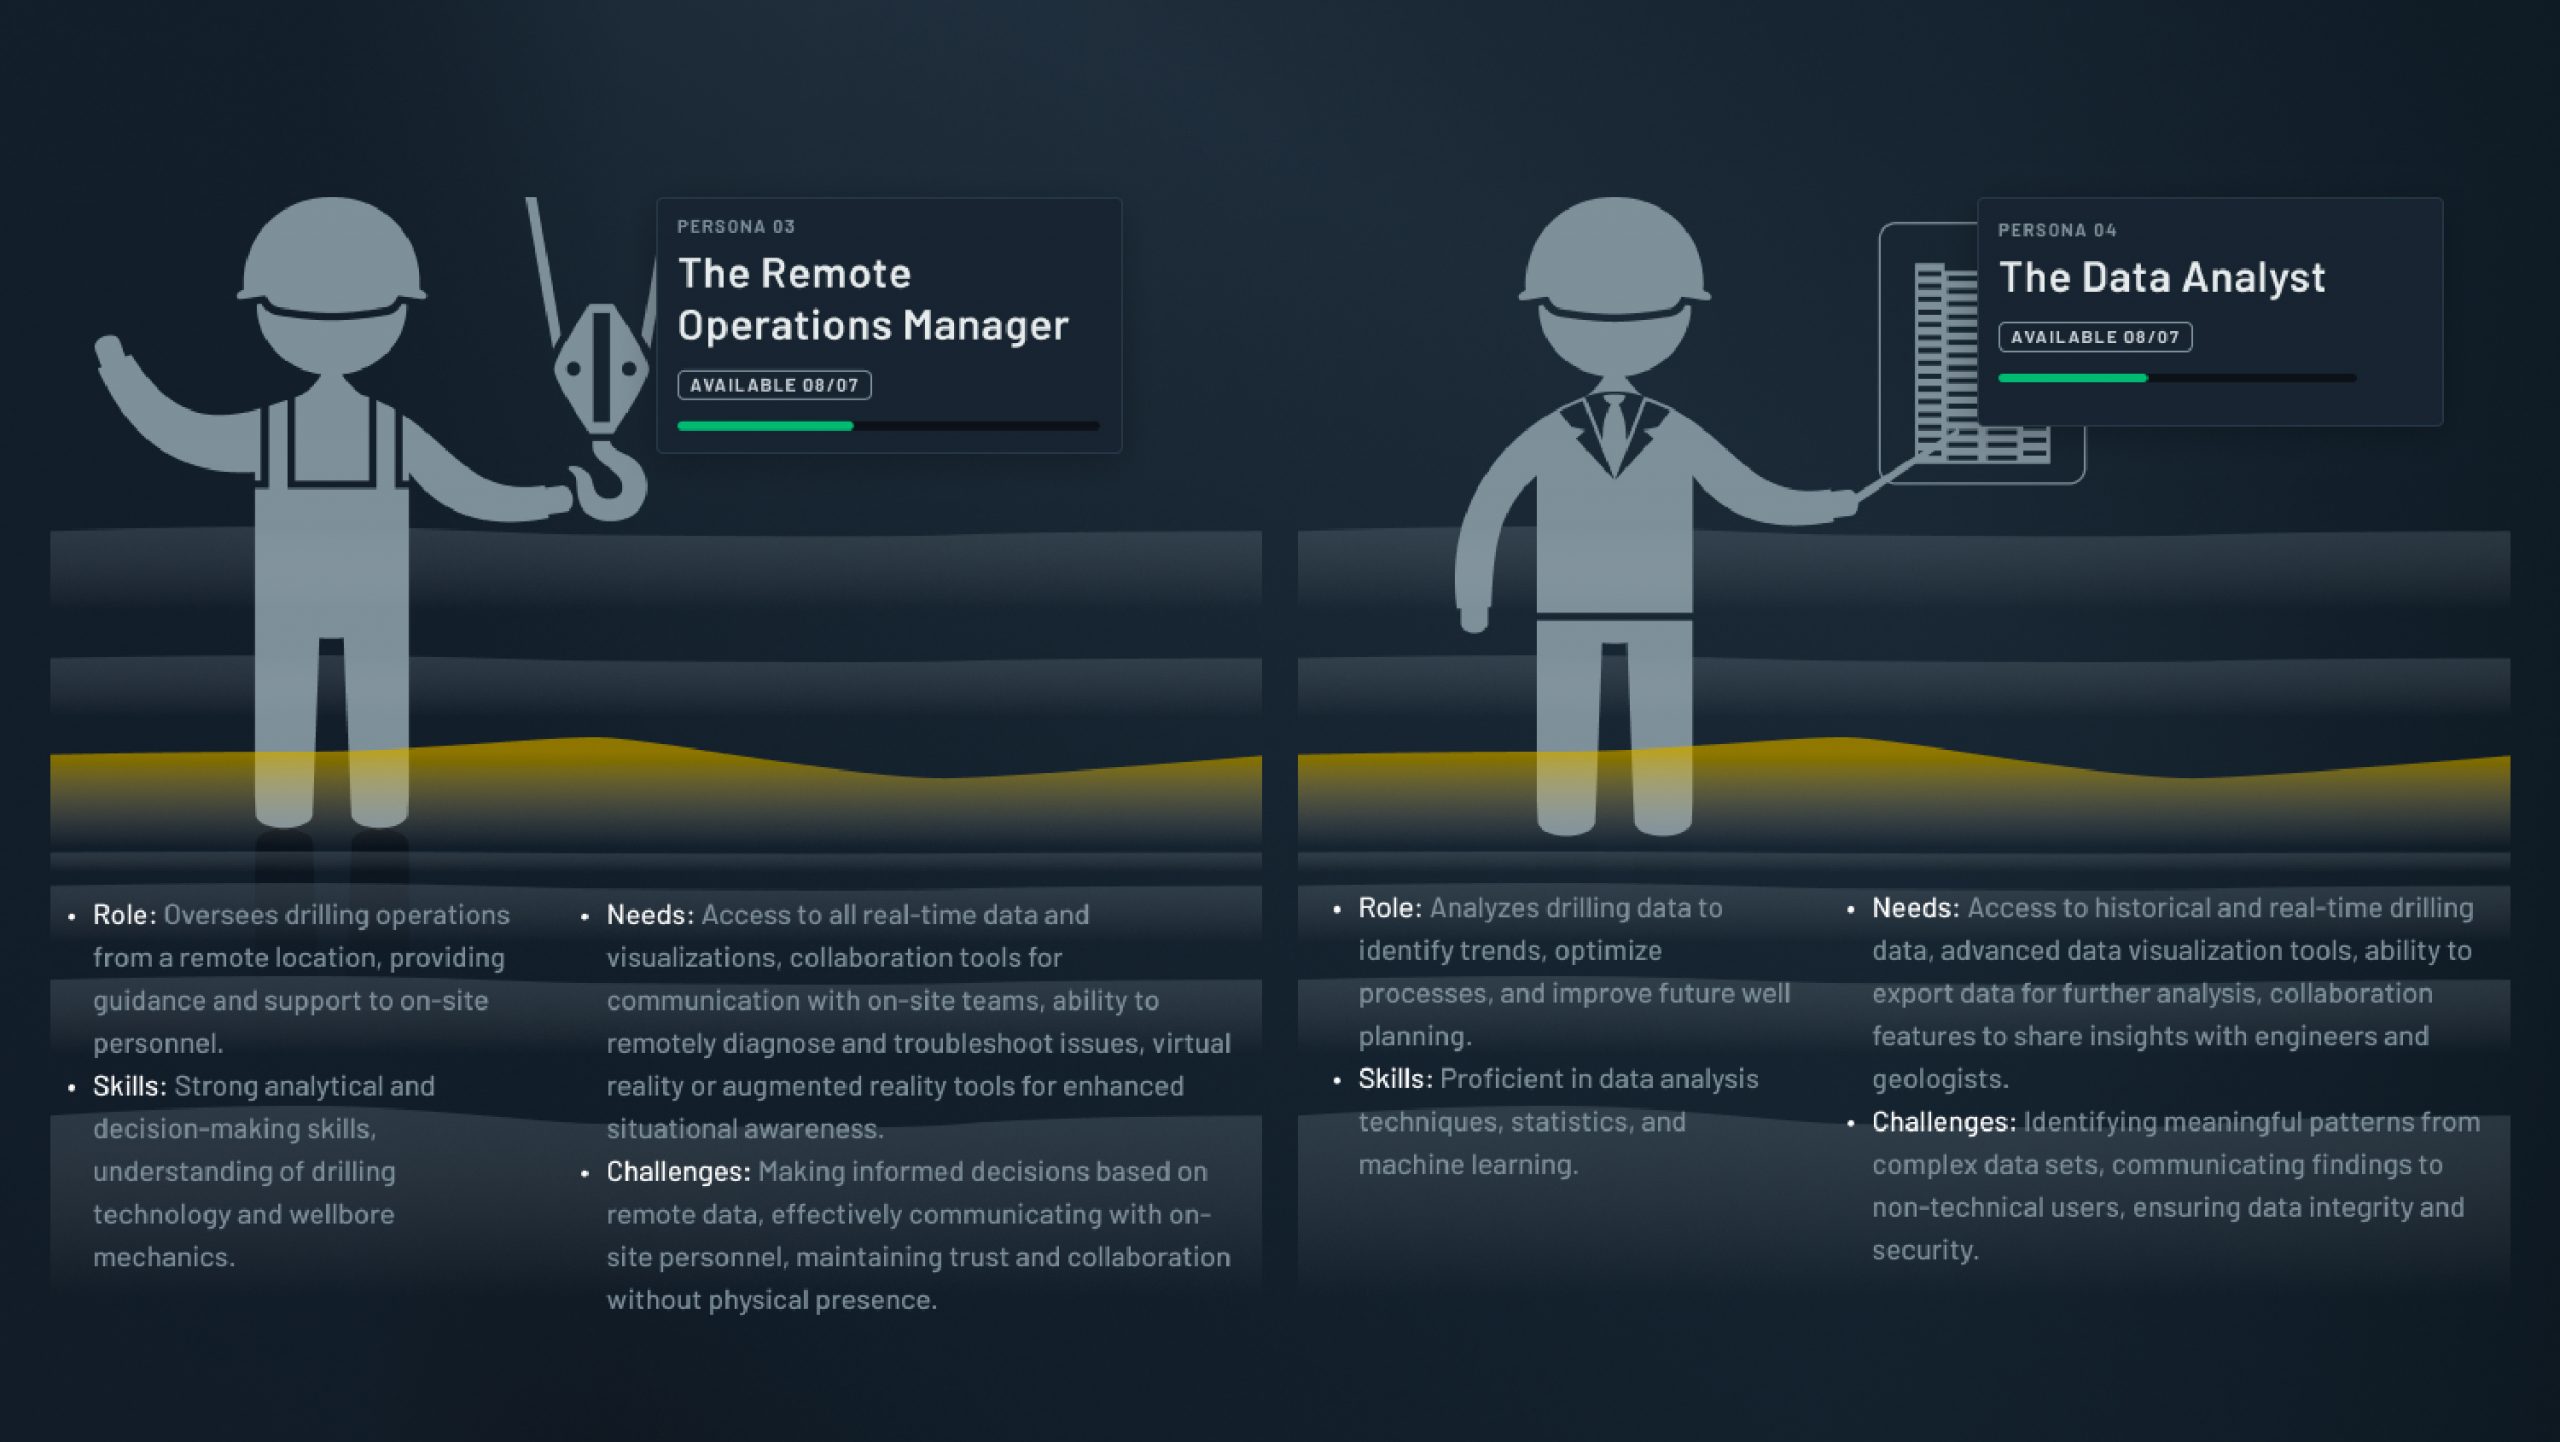
User personas
From this study, we could further segment our main user into five groups:The Drilling Engineer, The Geologist, The Drilling Supervisor, The Remote Operations Manager, The Data Analyst. We also broke down the users by their roles, skills, needs and challenges
Week 1
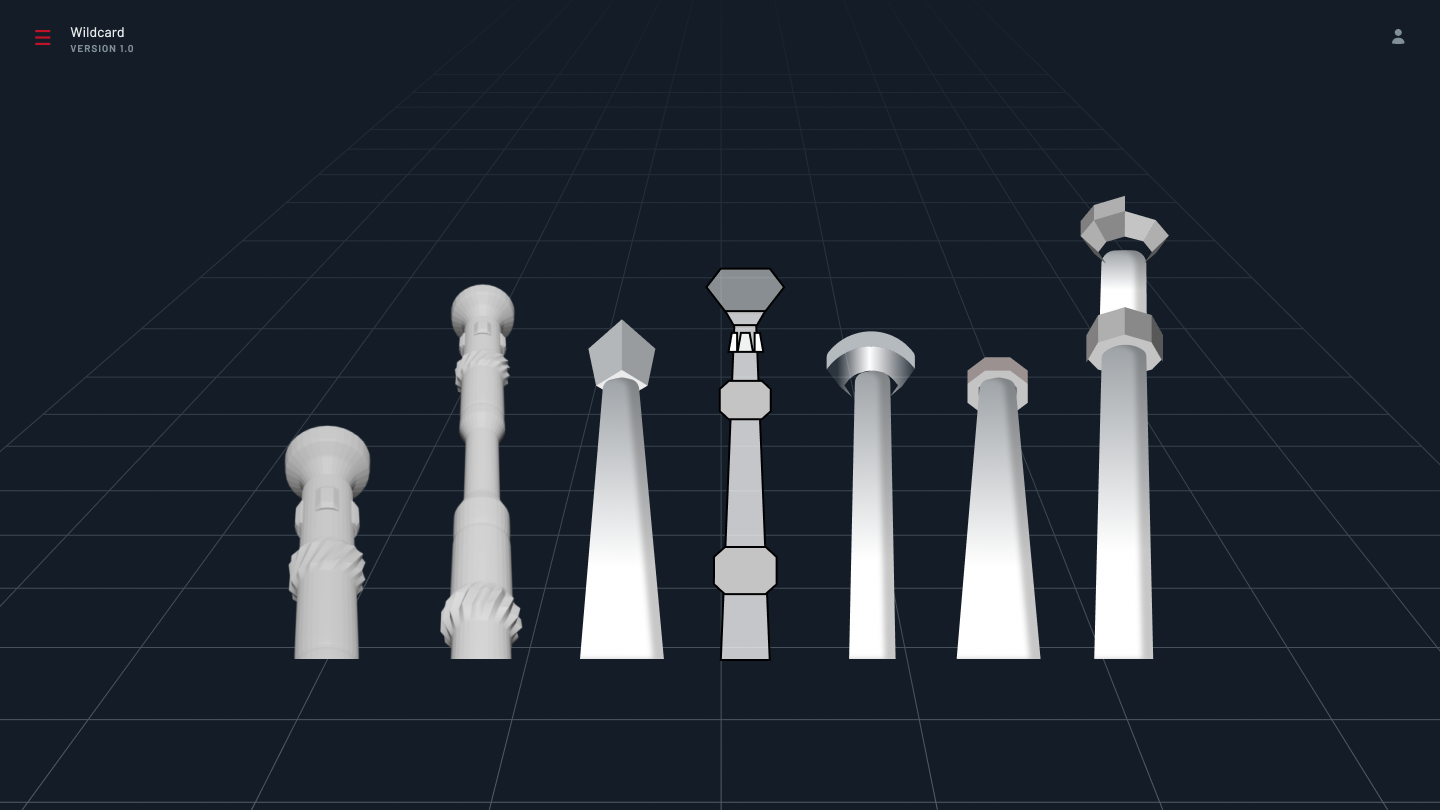
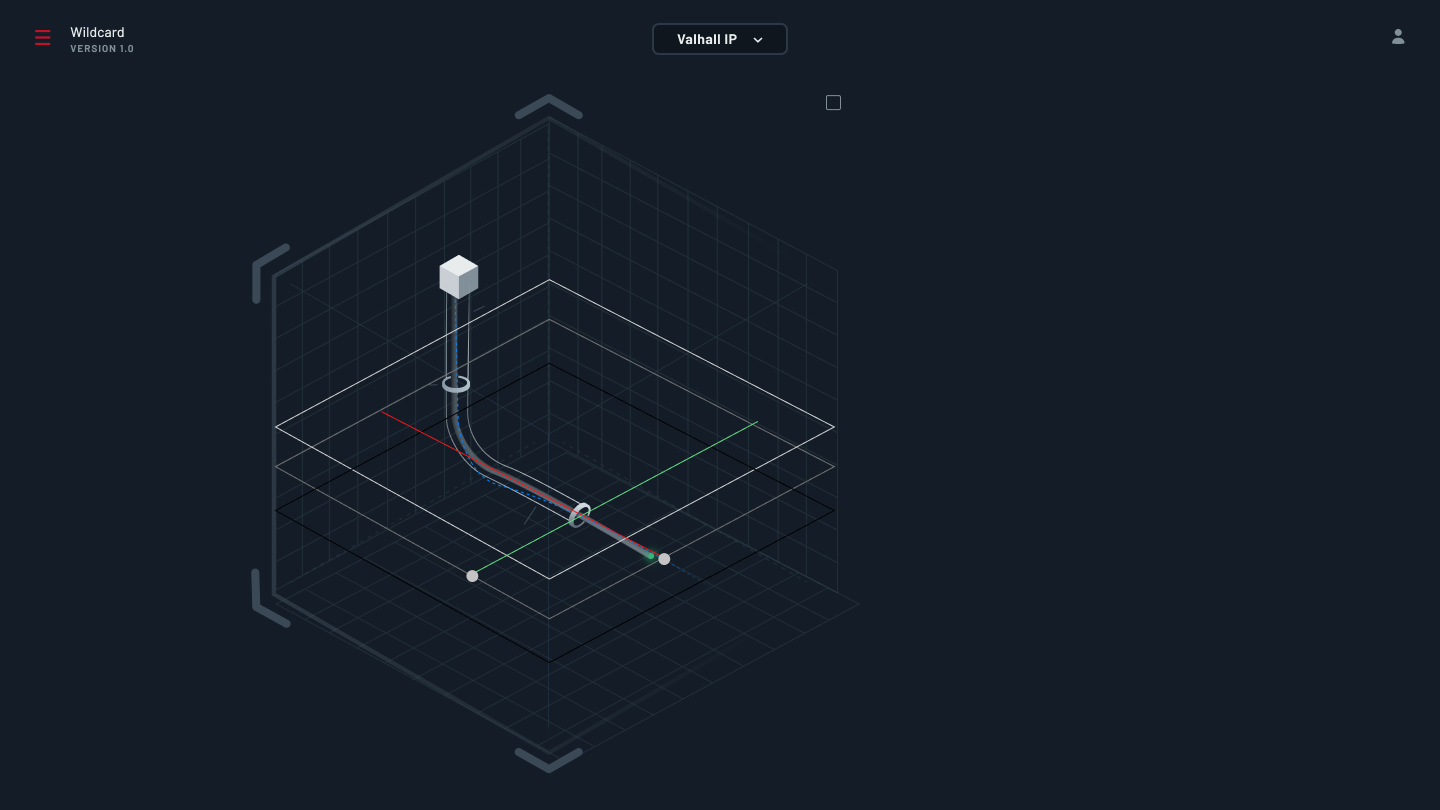
Initial Starting Visuals
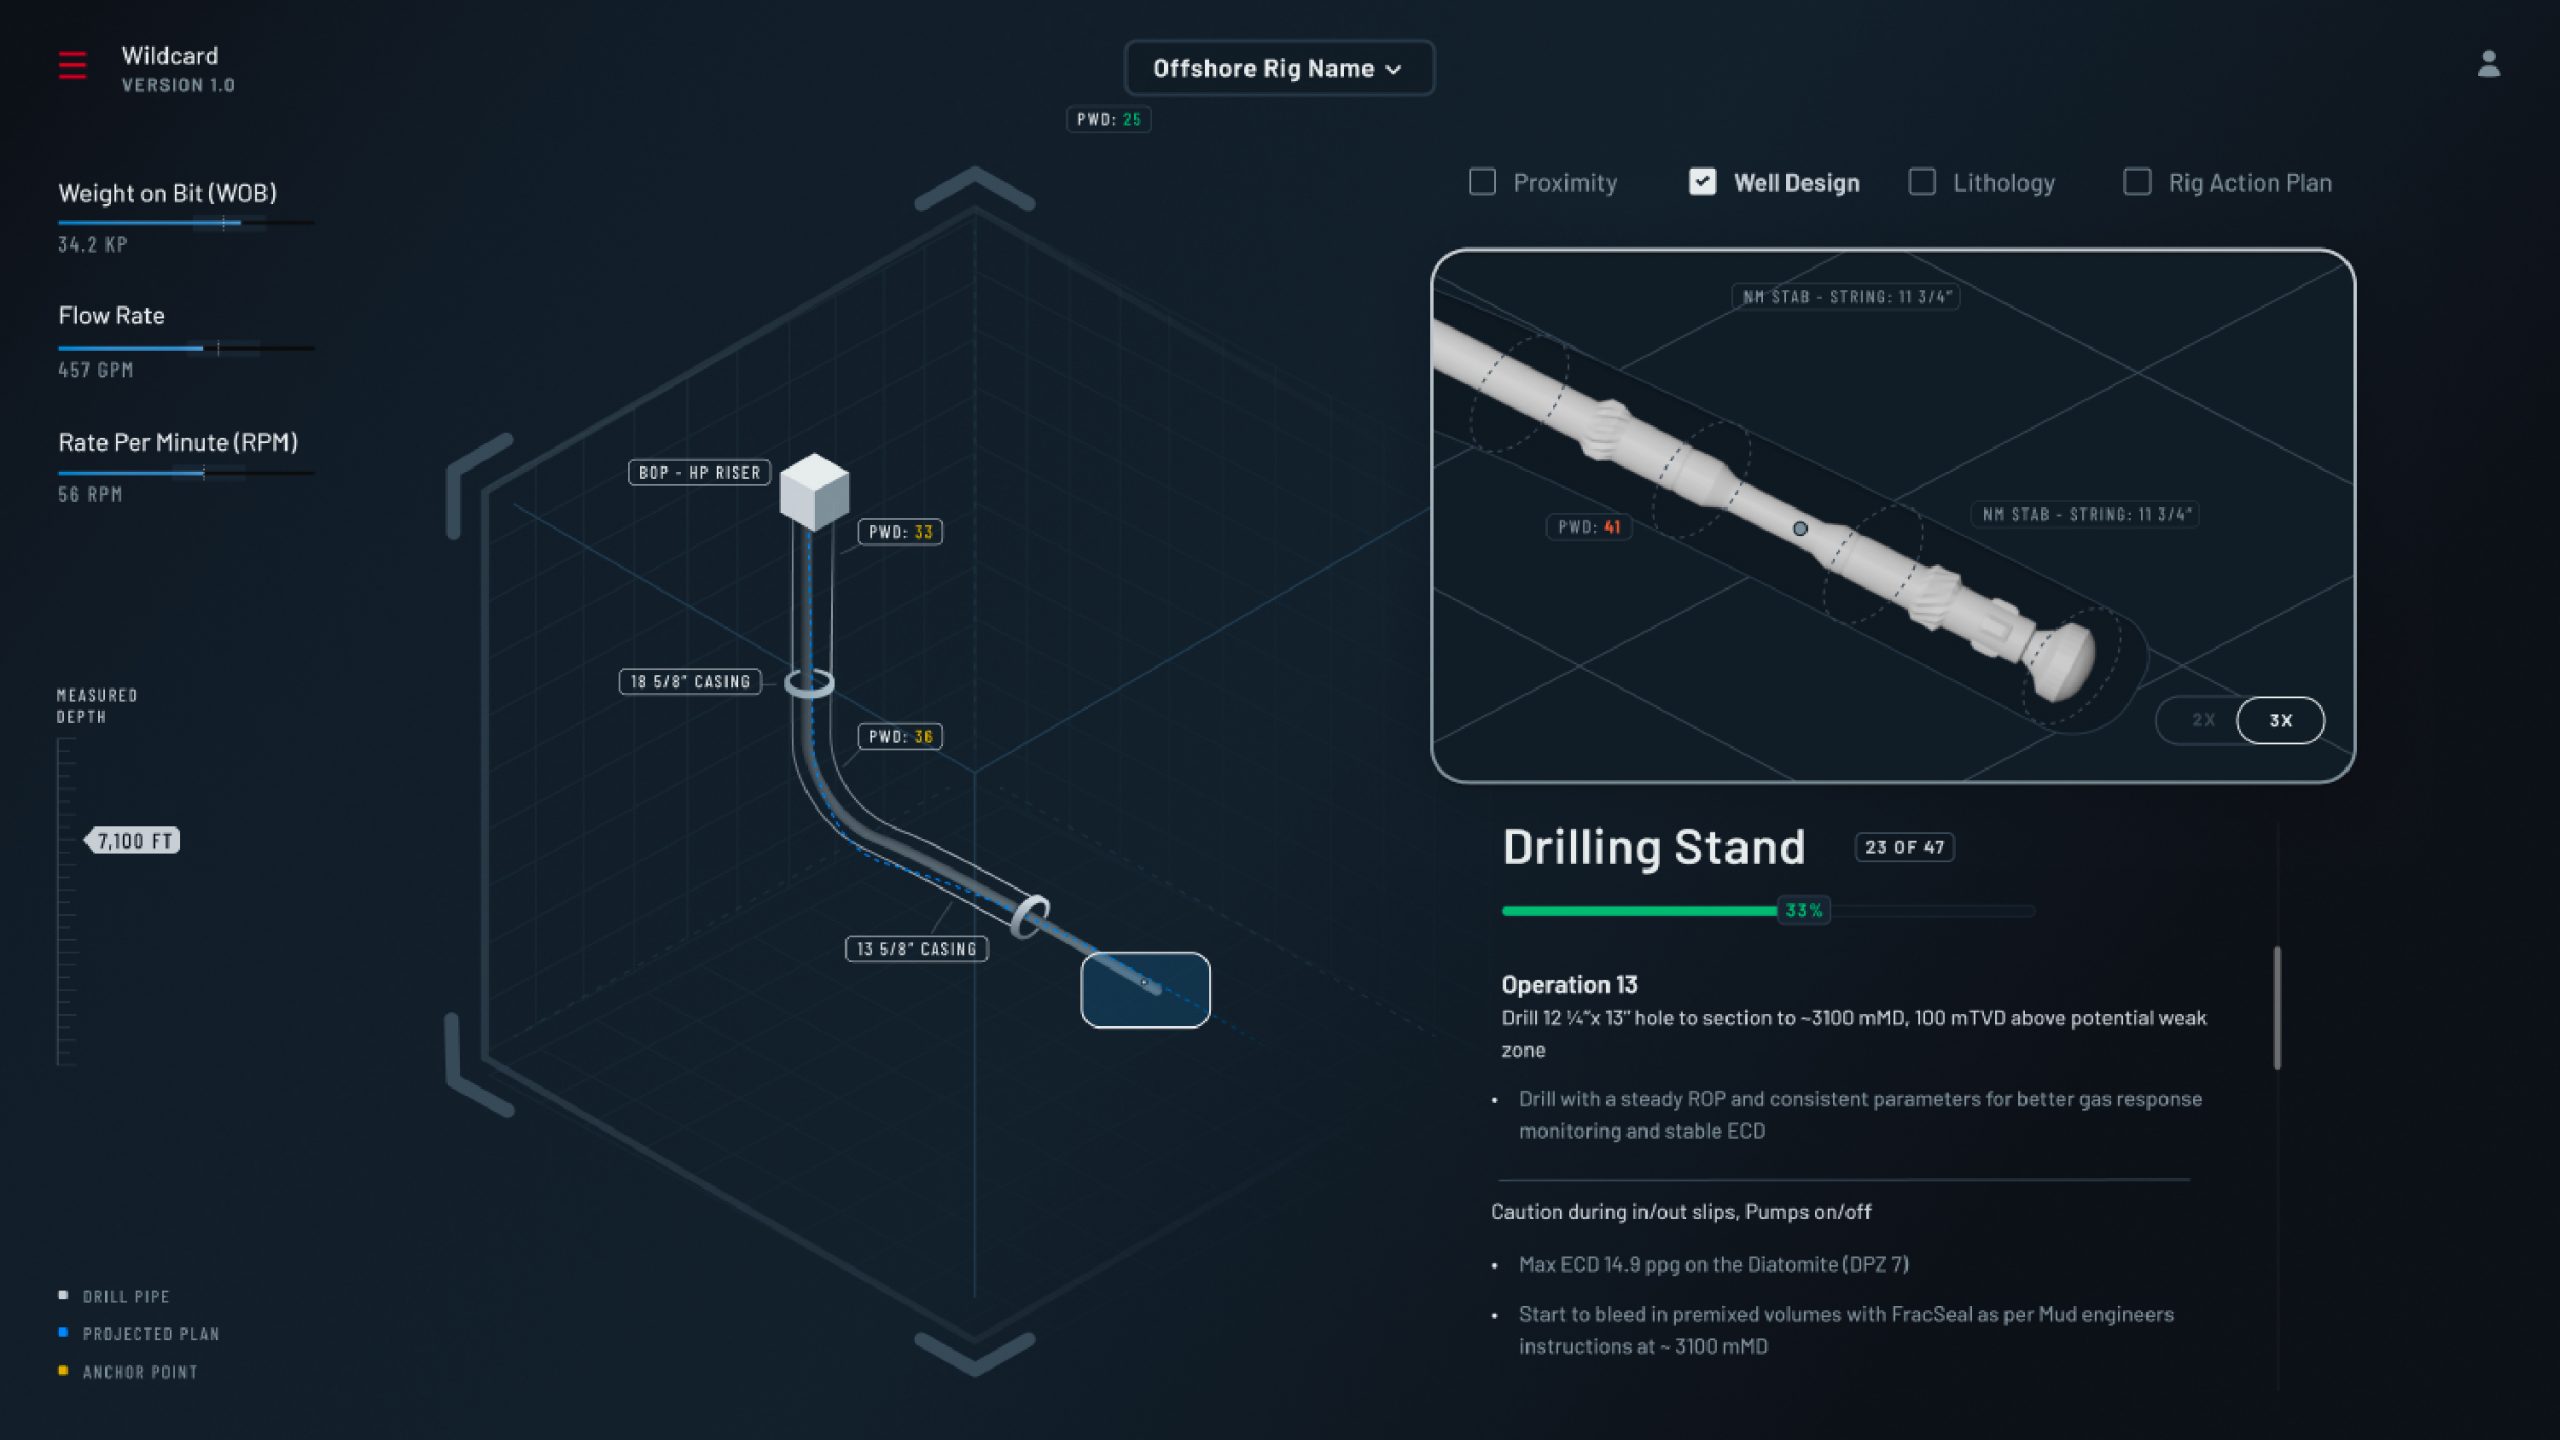
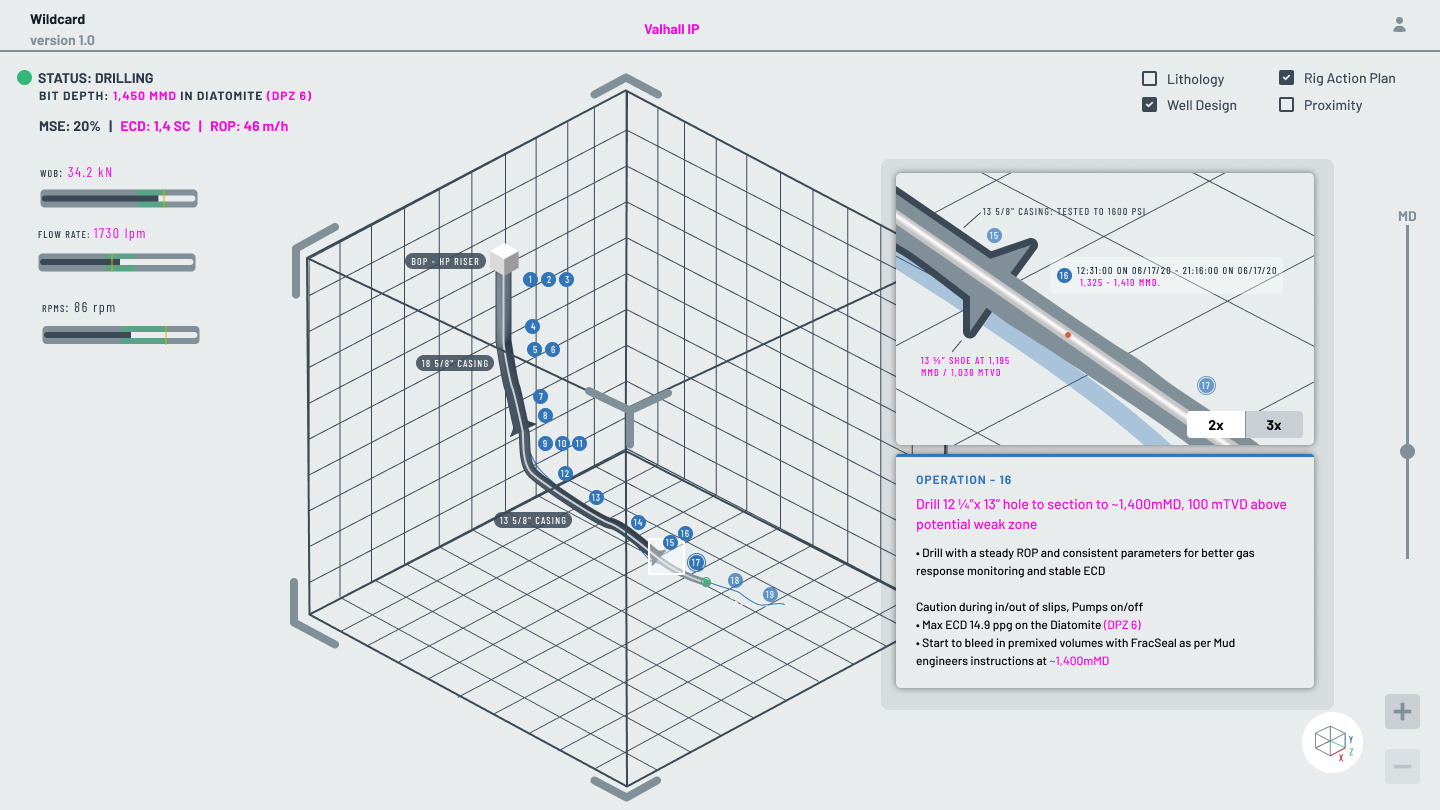
Developing the initial models and components for Halliburton’s 3D Automated Drilling Solution Platform (3D ADSP) involves several crucial steps:
Step 1
3D Wellbore Modeling and Visualization:
- Develop a 3D wellbore engine: Create a robust engine capable of generating and rendering accurate 3D models of wellbores in real-time. Consider using established libraries like OpenGL or Vulkan for efficient graphics rendering.
- Integrate real-time data: Integrate real-time data feeds from sensors and drilling processes into the 3D model, enabling dynamic visualization of wellbore progress, formation layers, and downhole conditions.

Step 2
Data Acquisition and Preparation:
- Gather real-world drilling data: Collect high-quality data from sensors, drilling logs, and historical records covering various well types, formations, and drilling conditions. This data serves as the foundation for model training and validation.
- Data pre-processing and cleaning: Clean and pre-process the collected data to address missing values, outliers, and inconsistencies. Ensure data standardization for compatibility with chosen modeling tools and algorithms.
Week 2
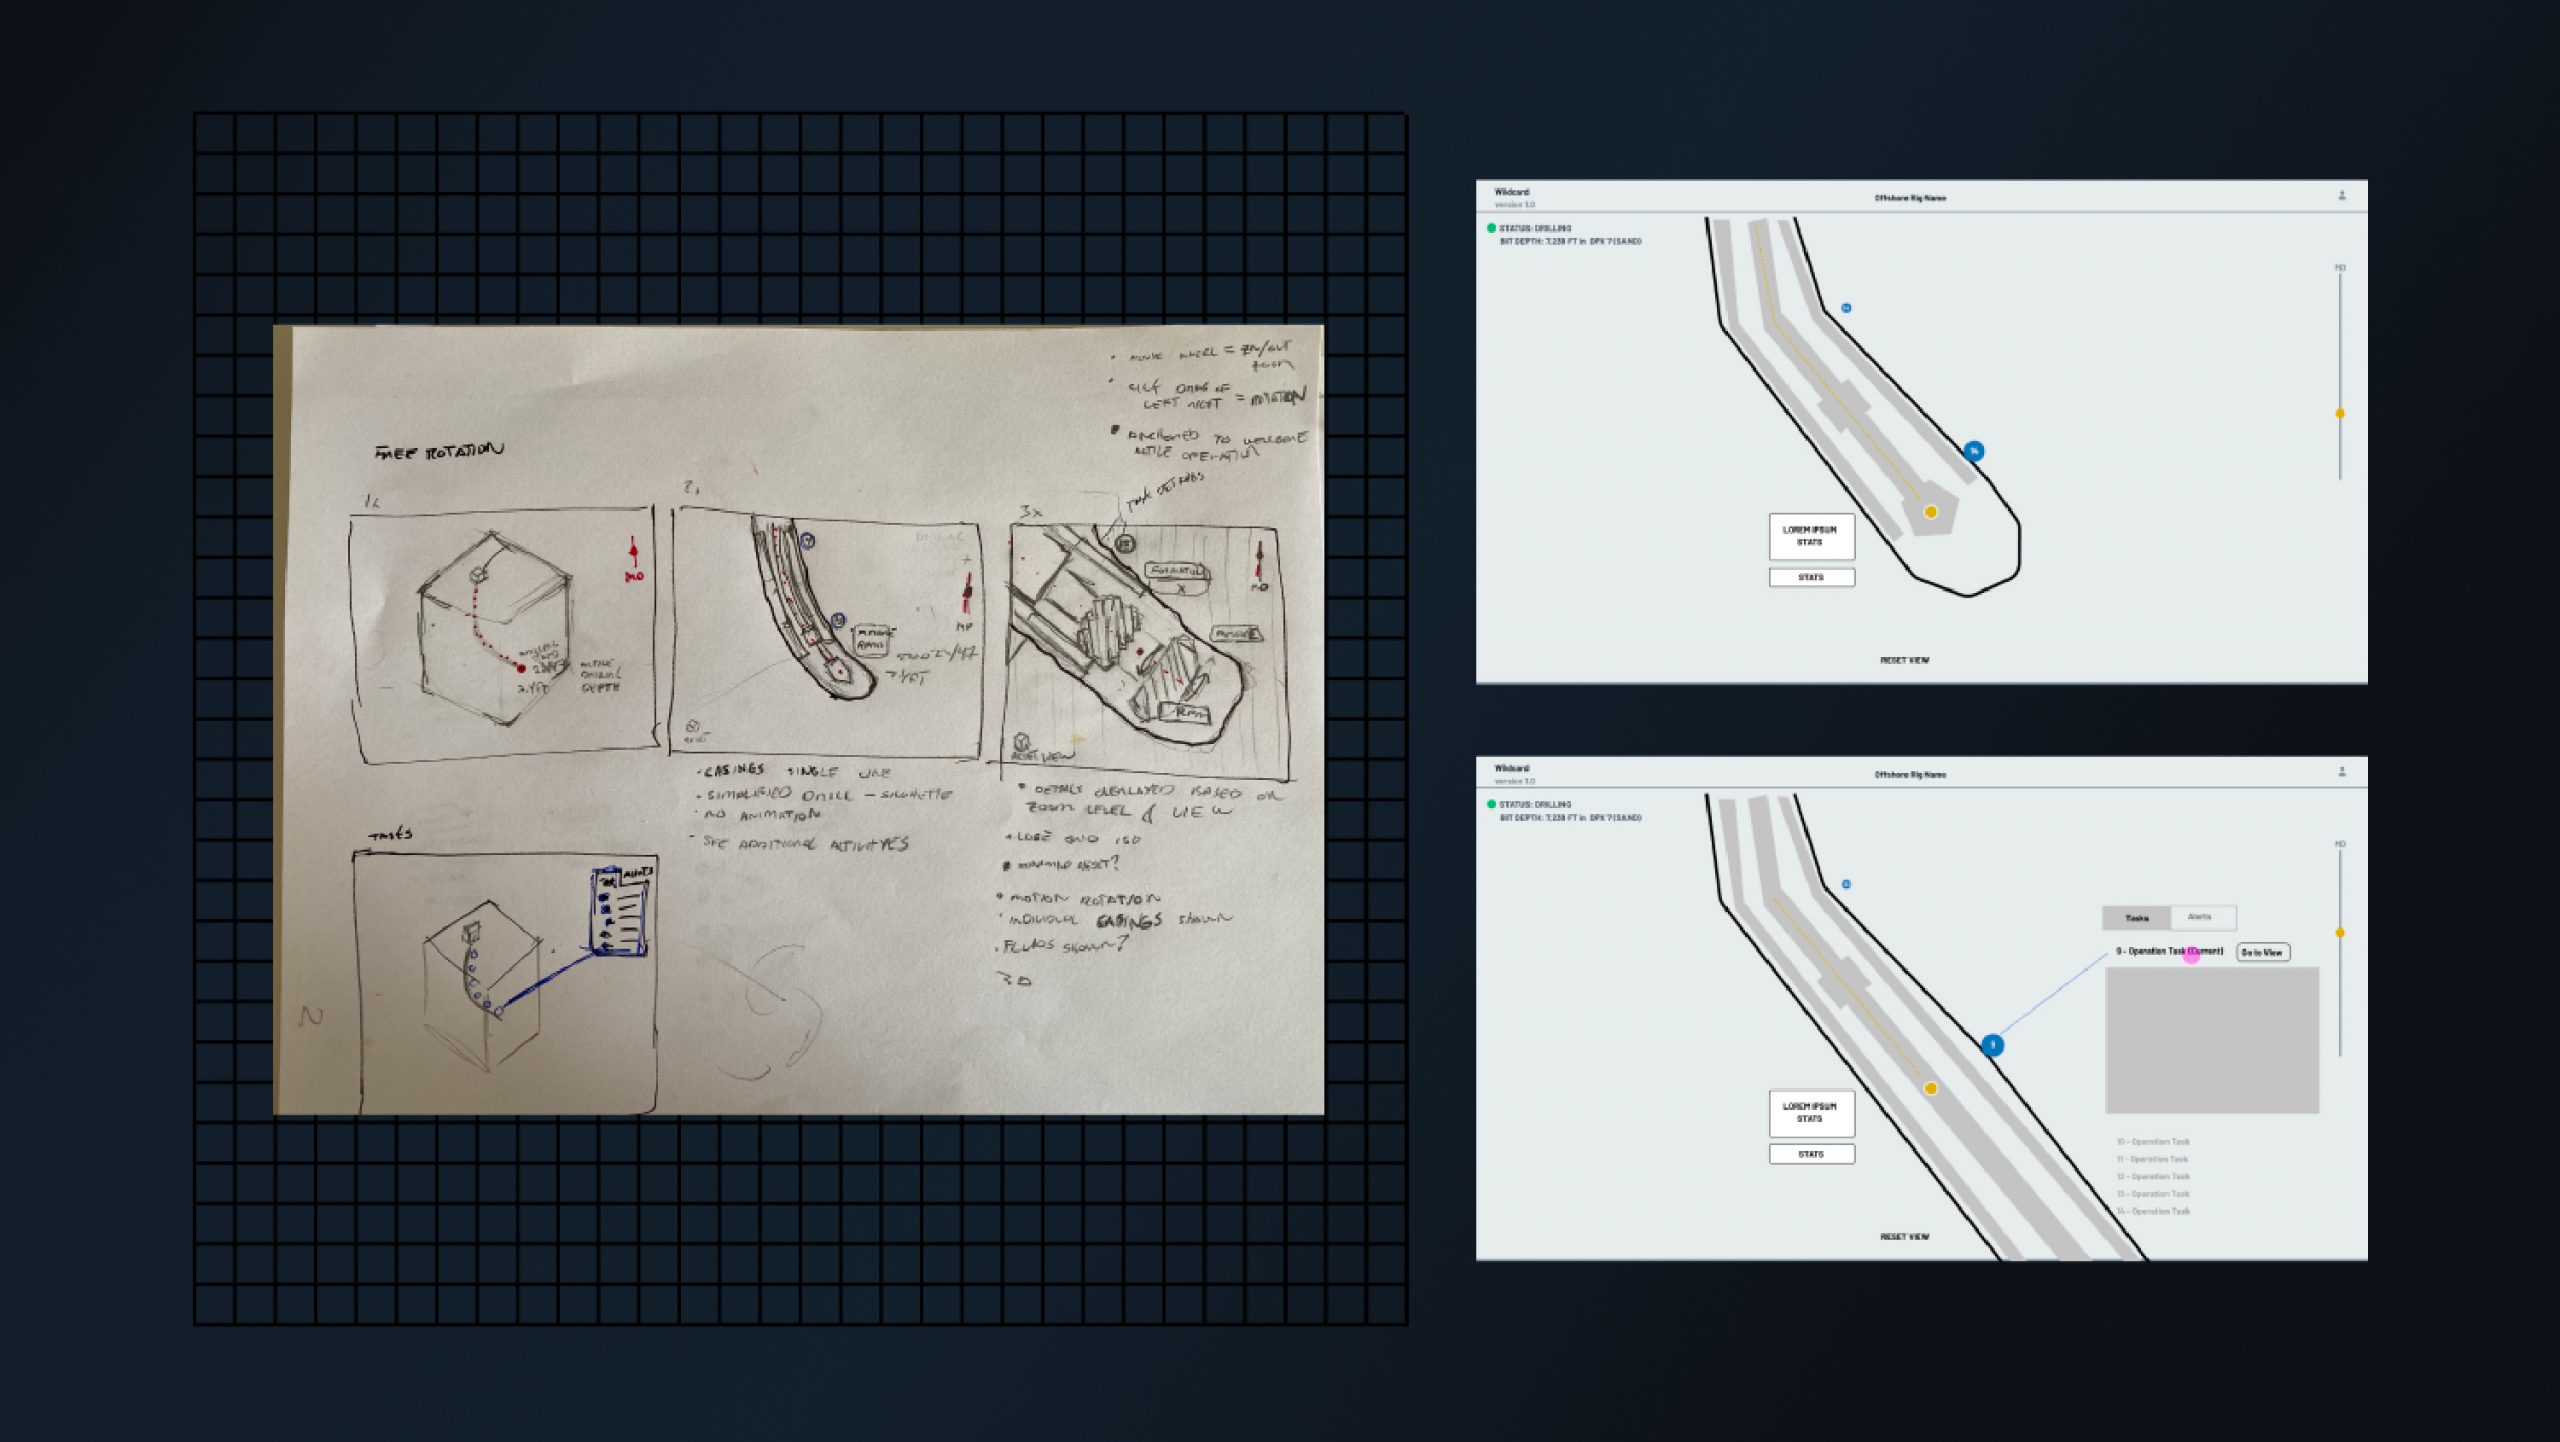
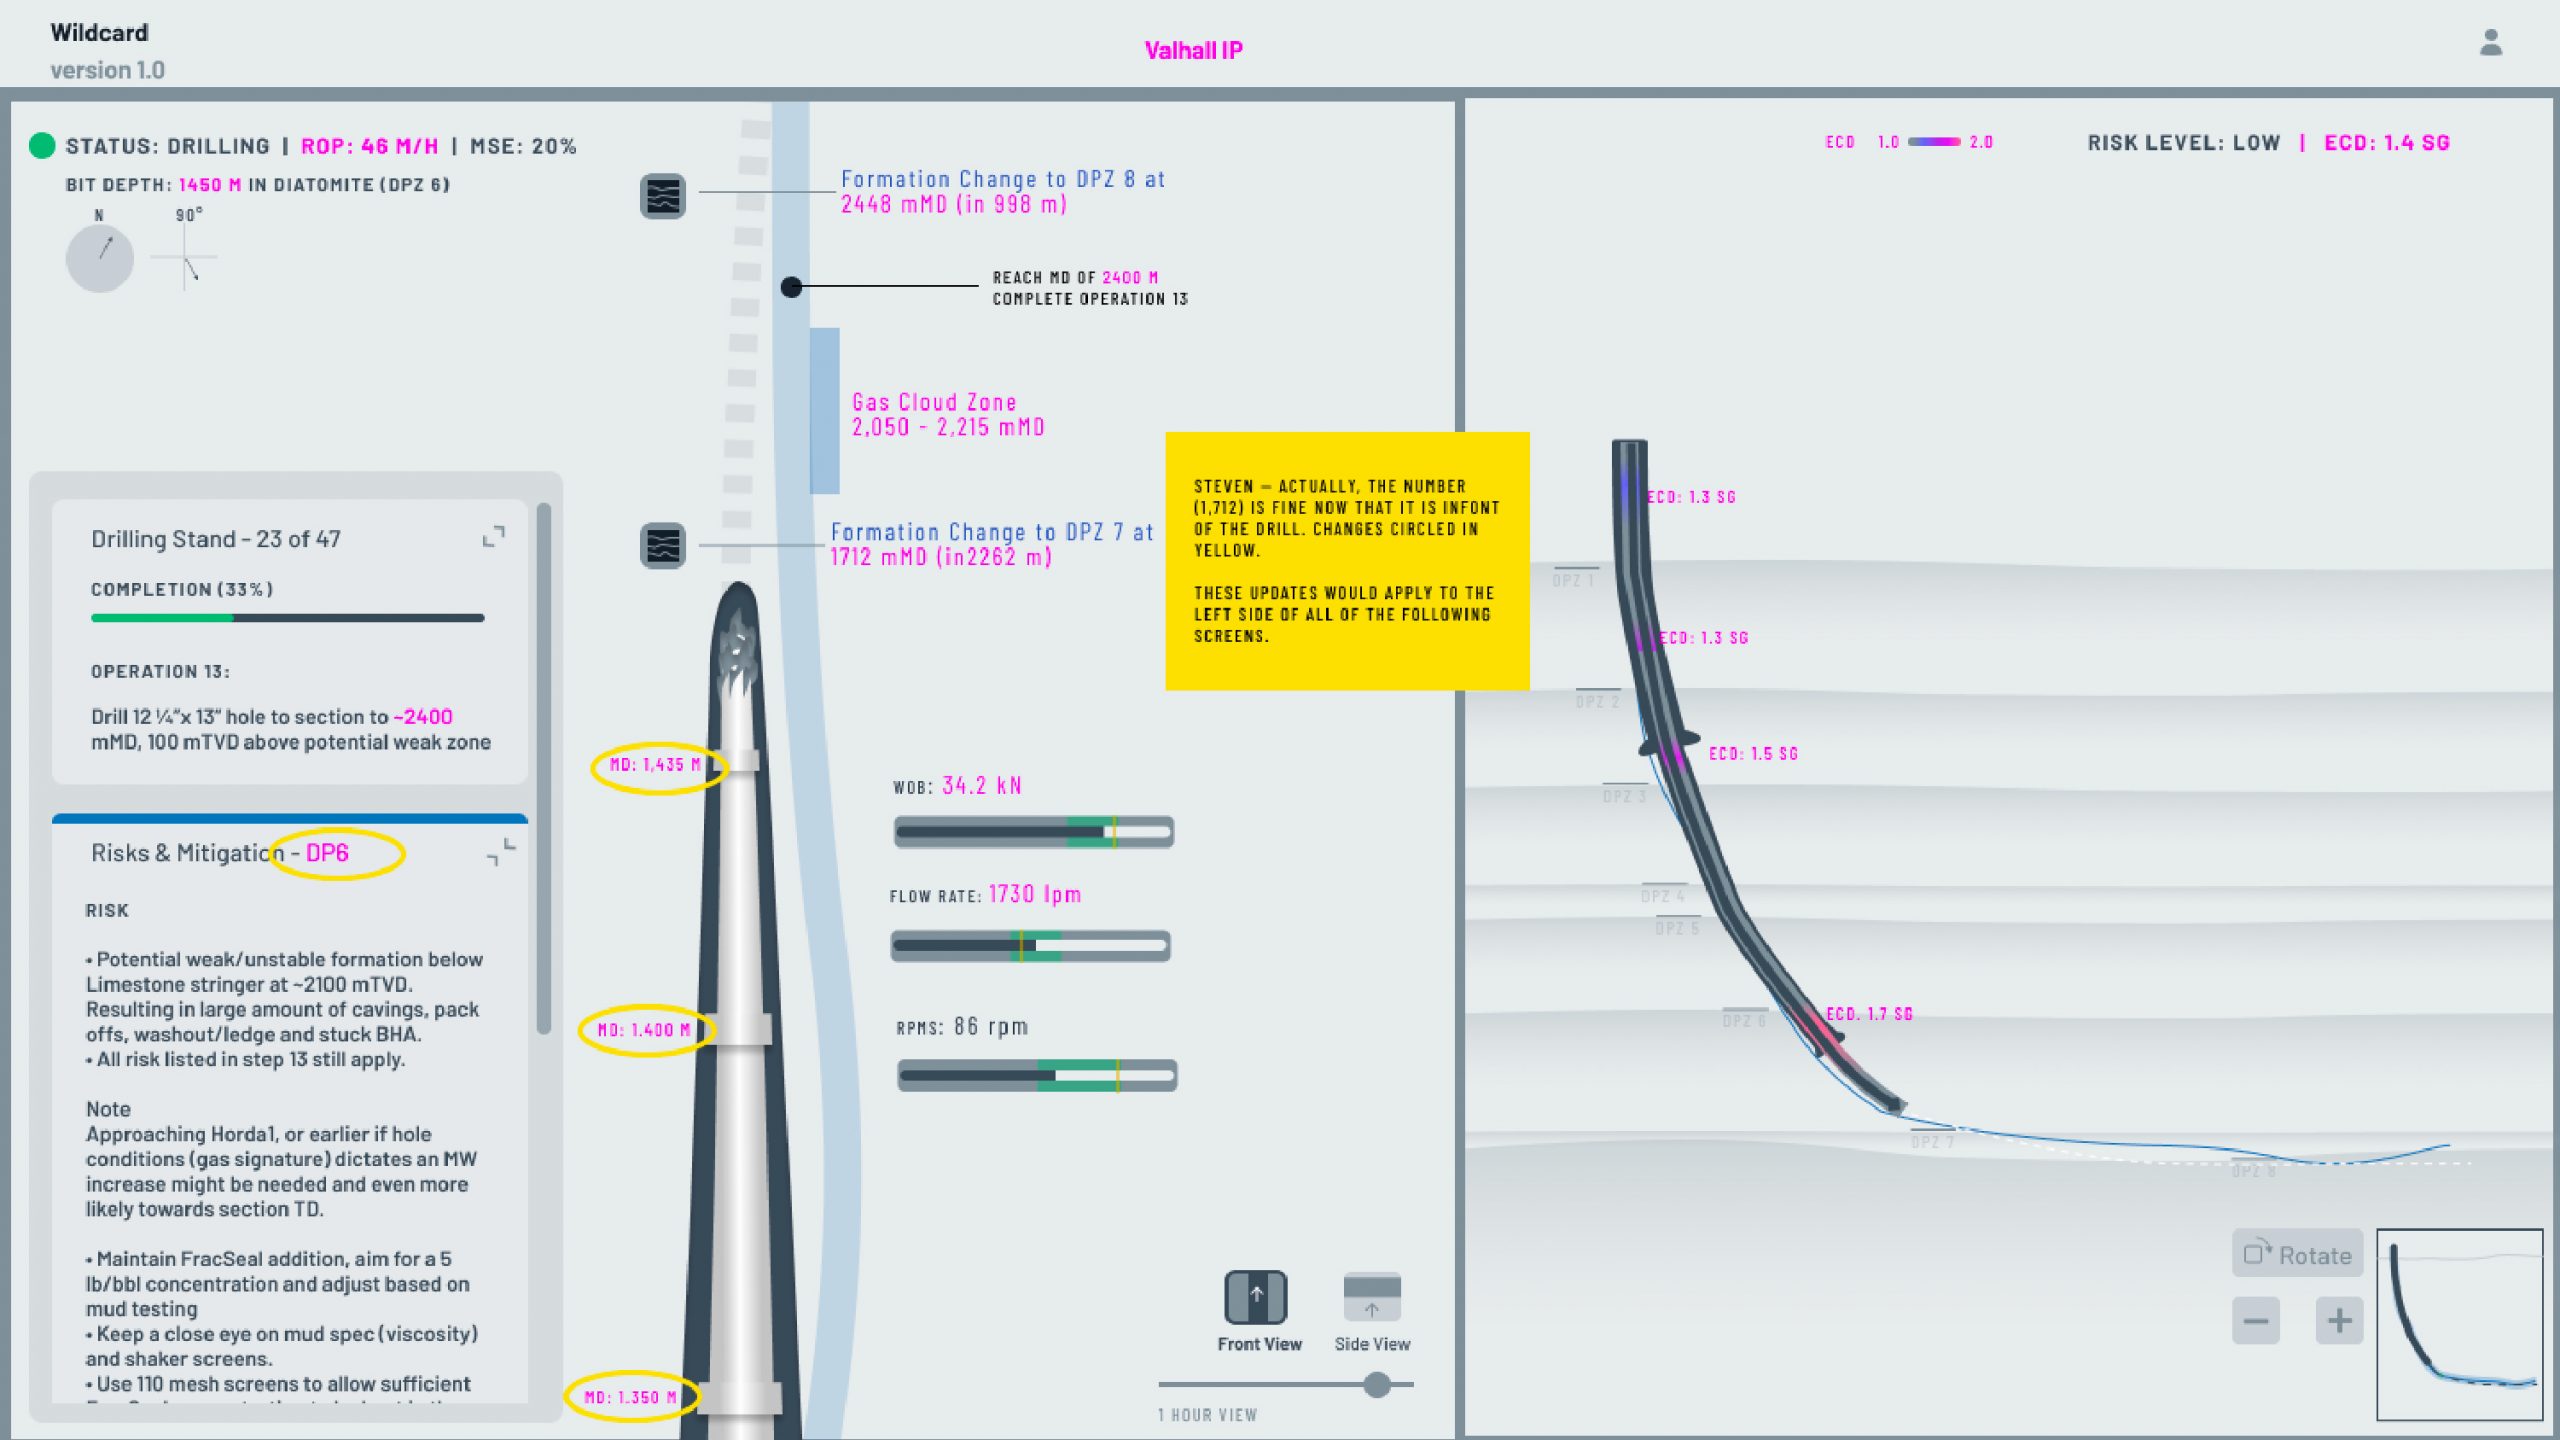
Approaching 3D Model Design
- What level of detail is necessary? Balance detail with performance and clarity. Excessive detail can overwhelm users, while insufficient detail may limit their understanding.
- Data integration: Determine how real-time and historical data will be streamed into the 3D model and visualized effectively. Consider using established data visualization libraries like Matplotlib or Plotly for enhanced visual representation.
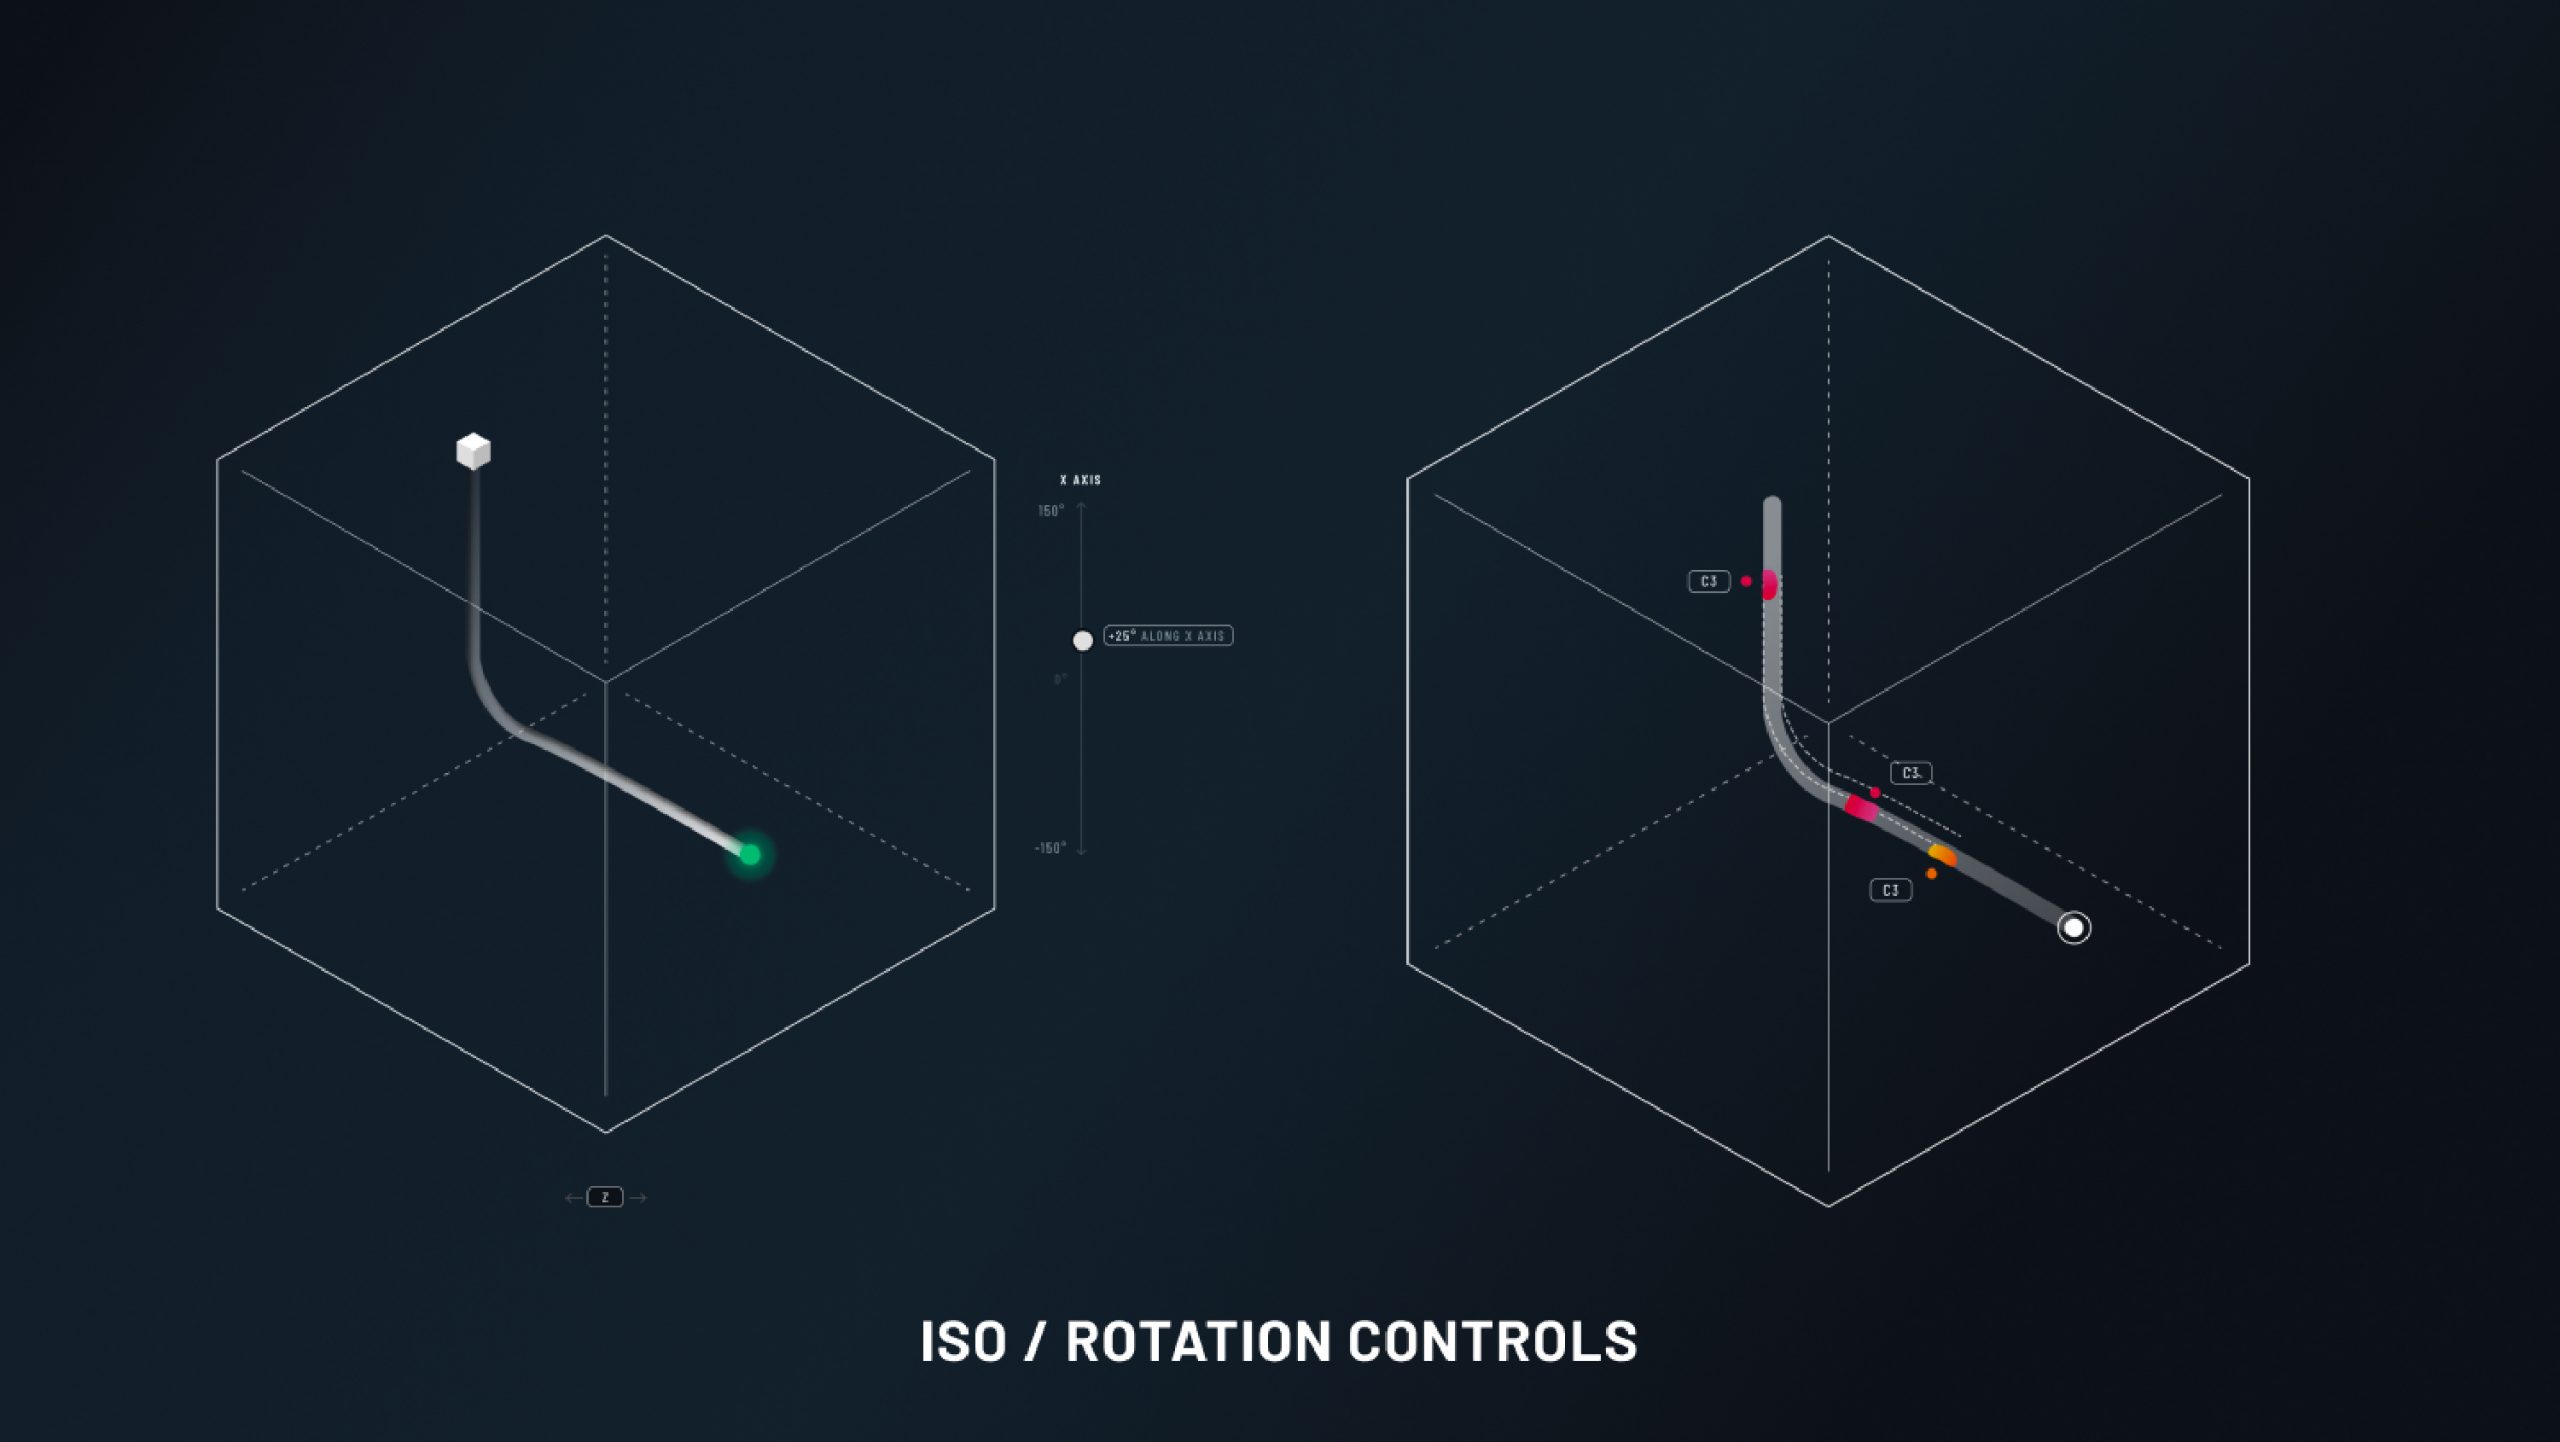
- Level of interactivity: Decide what level of interaction users should have with the 3D model. This could include zooming, rotating, highlighting specific elements, and overlaying data charts.
- Focus on clarity and legibility: Prioritize clear visuals and intuitive data representation. Use color, size, and transparency effectively to differentiate elements and avoid cognitive overload
week 3
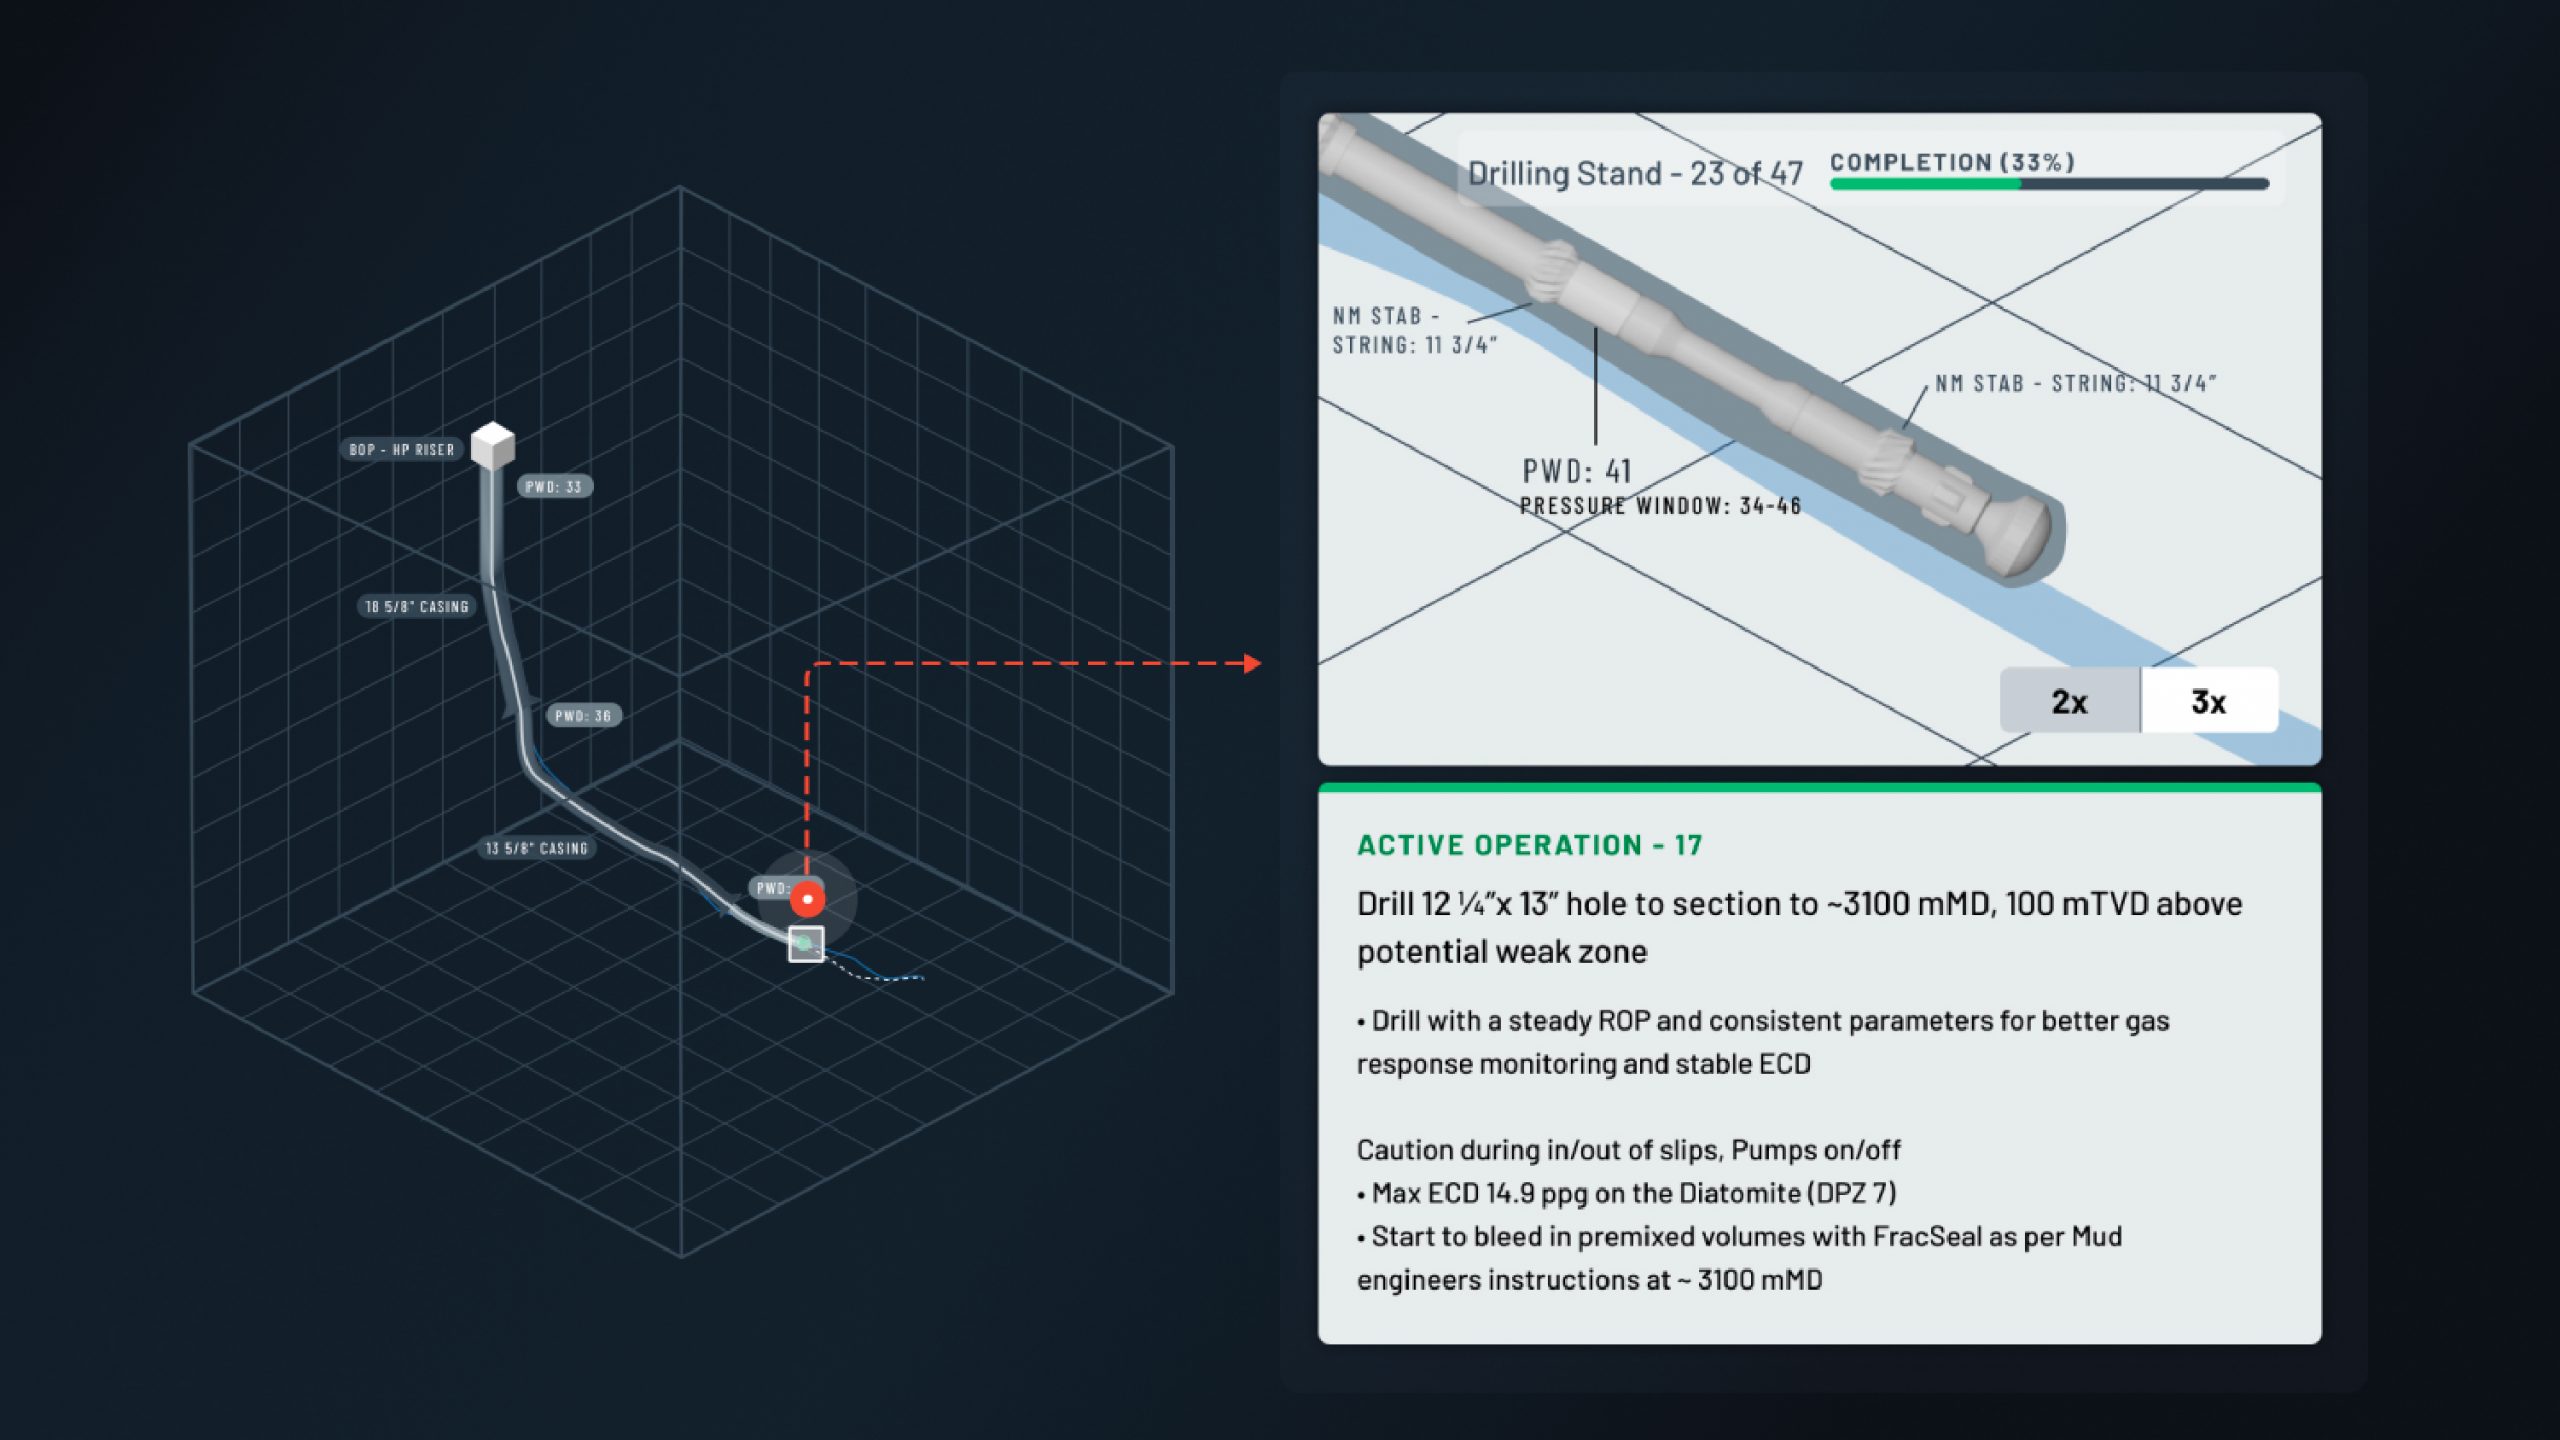
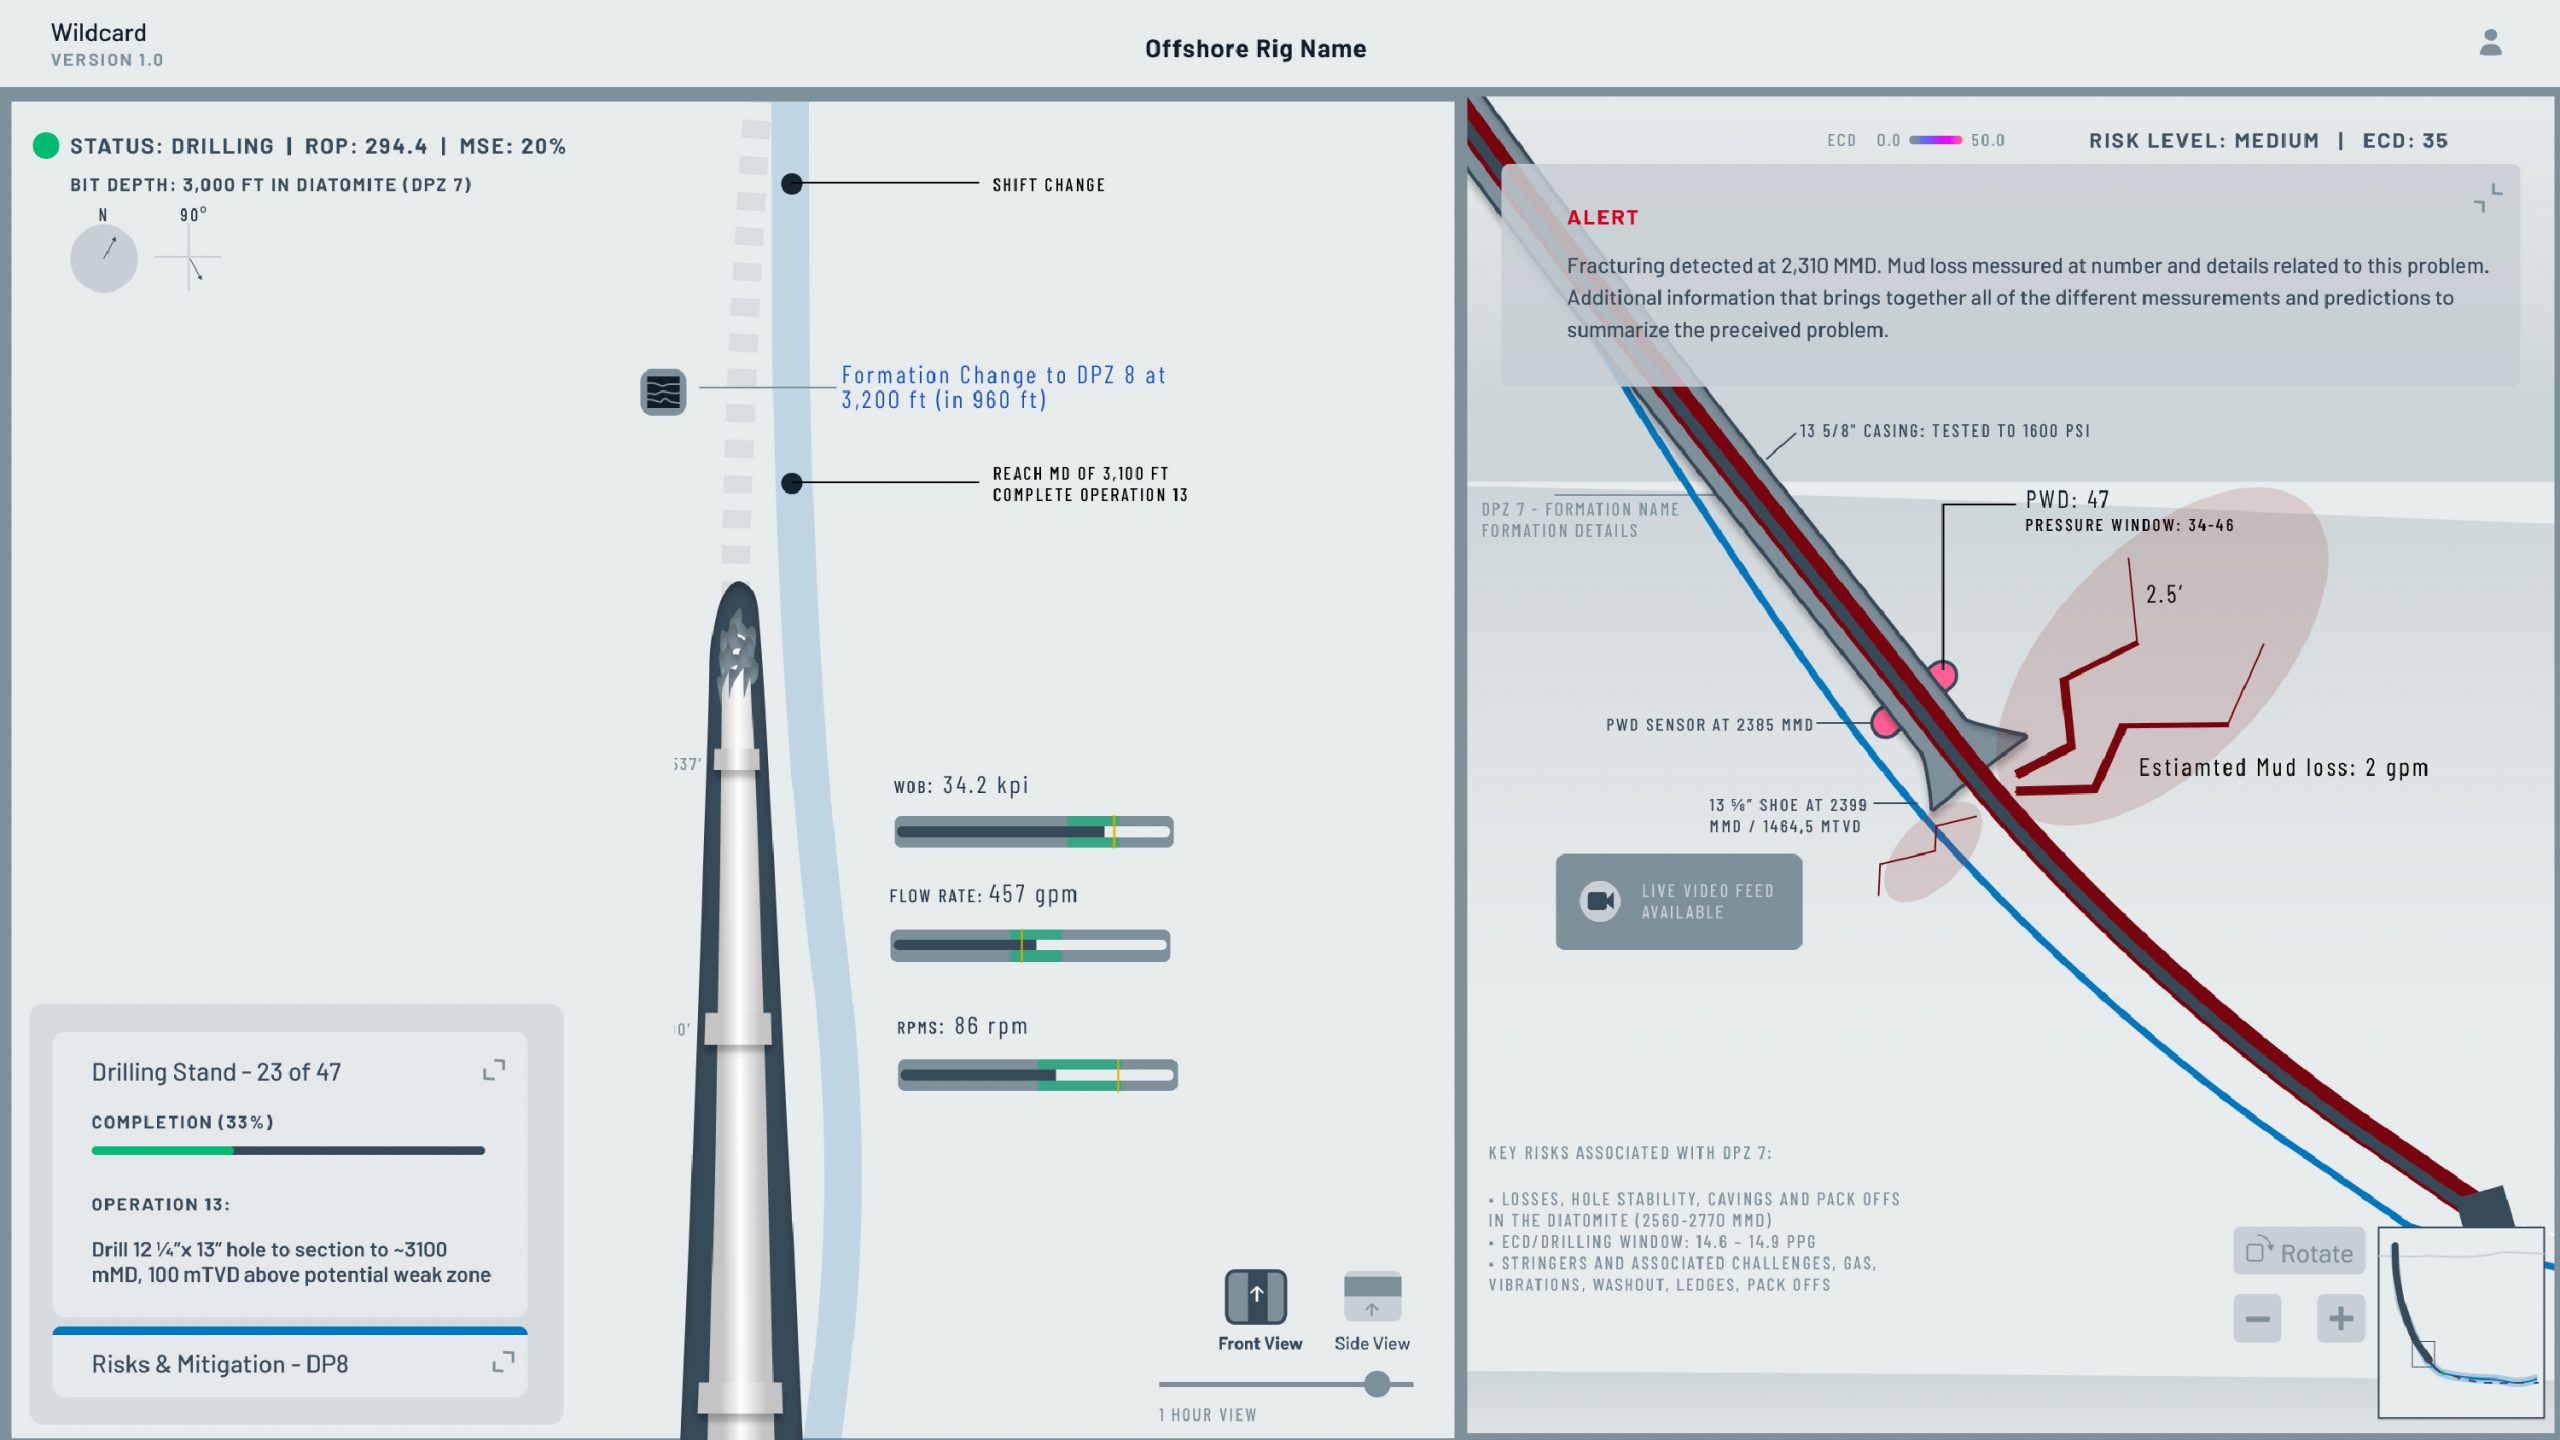
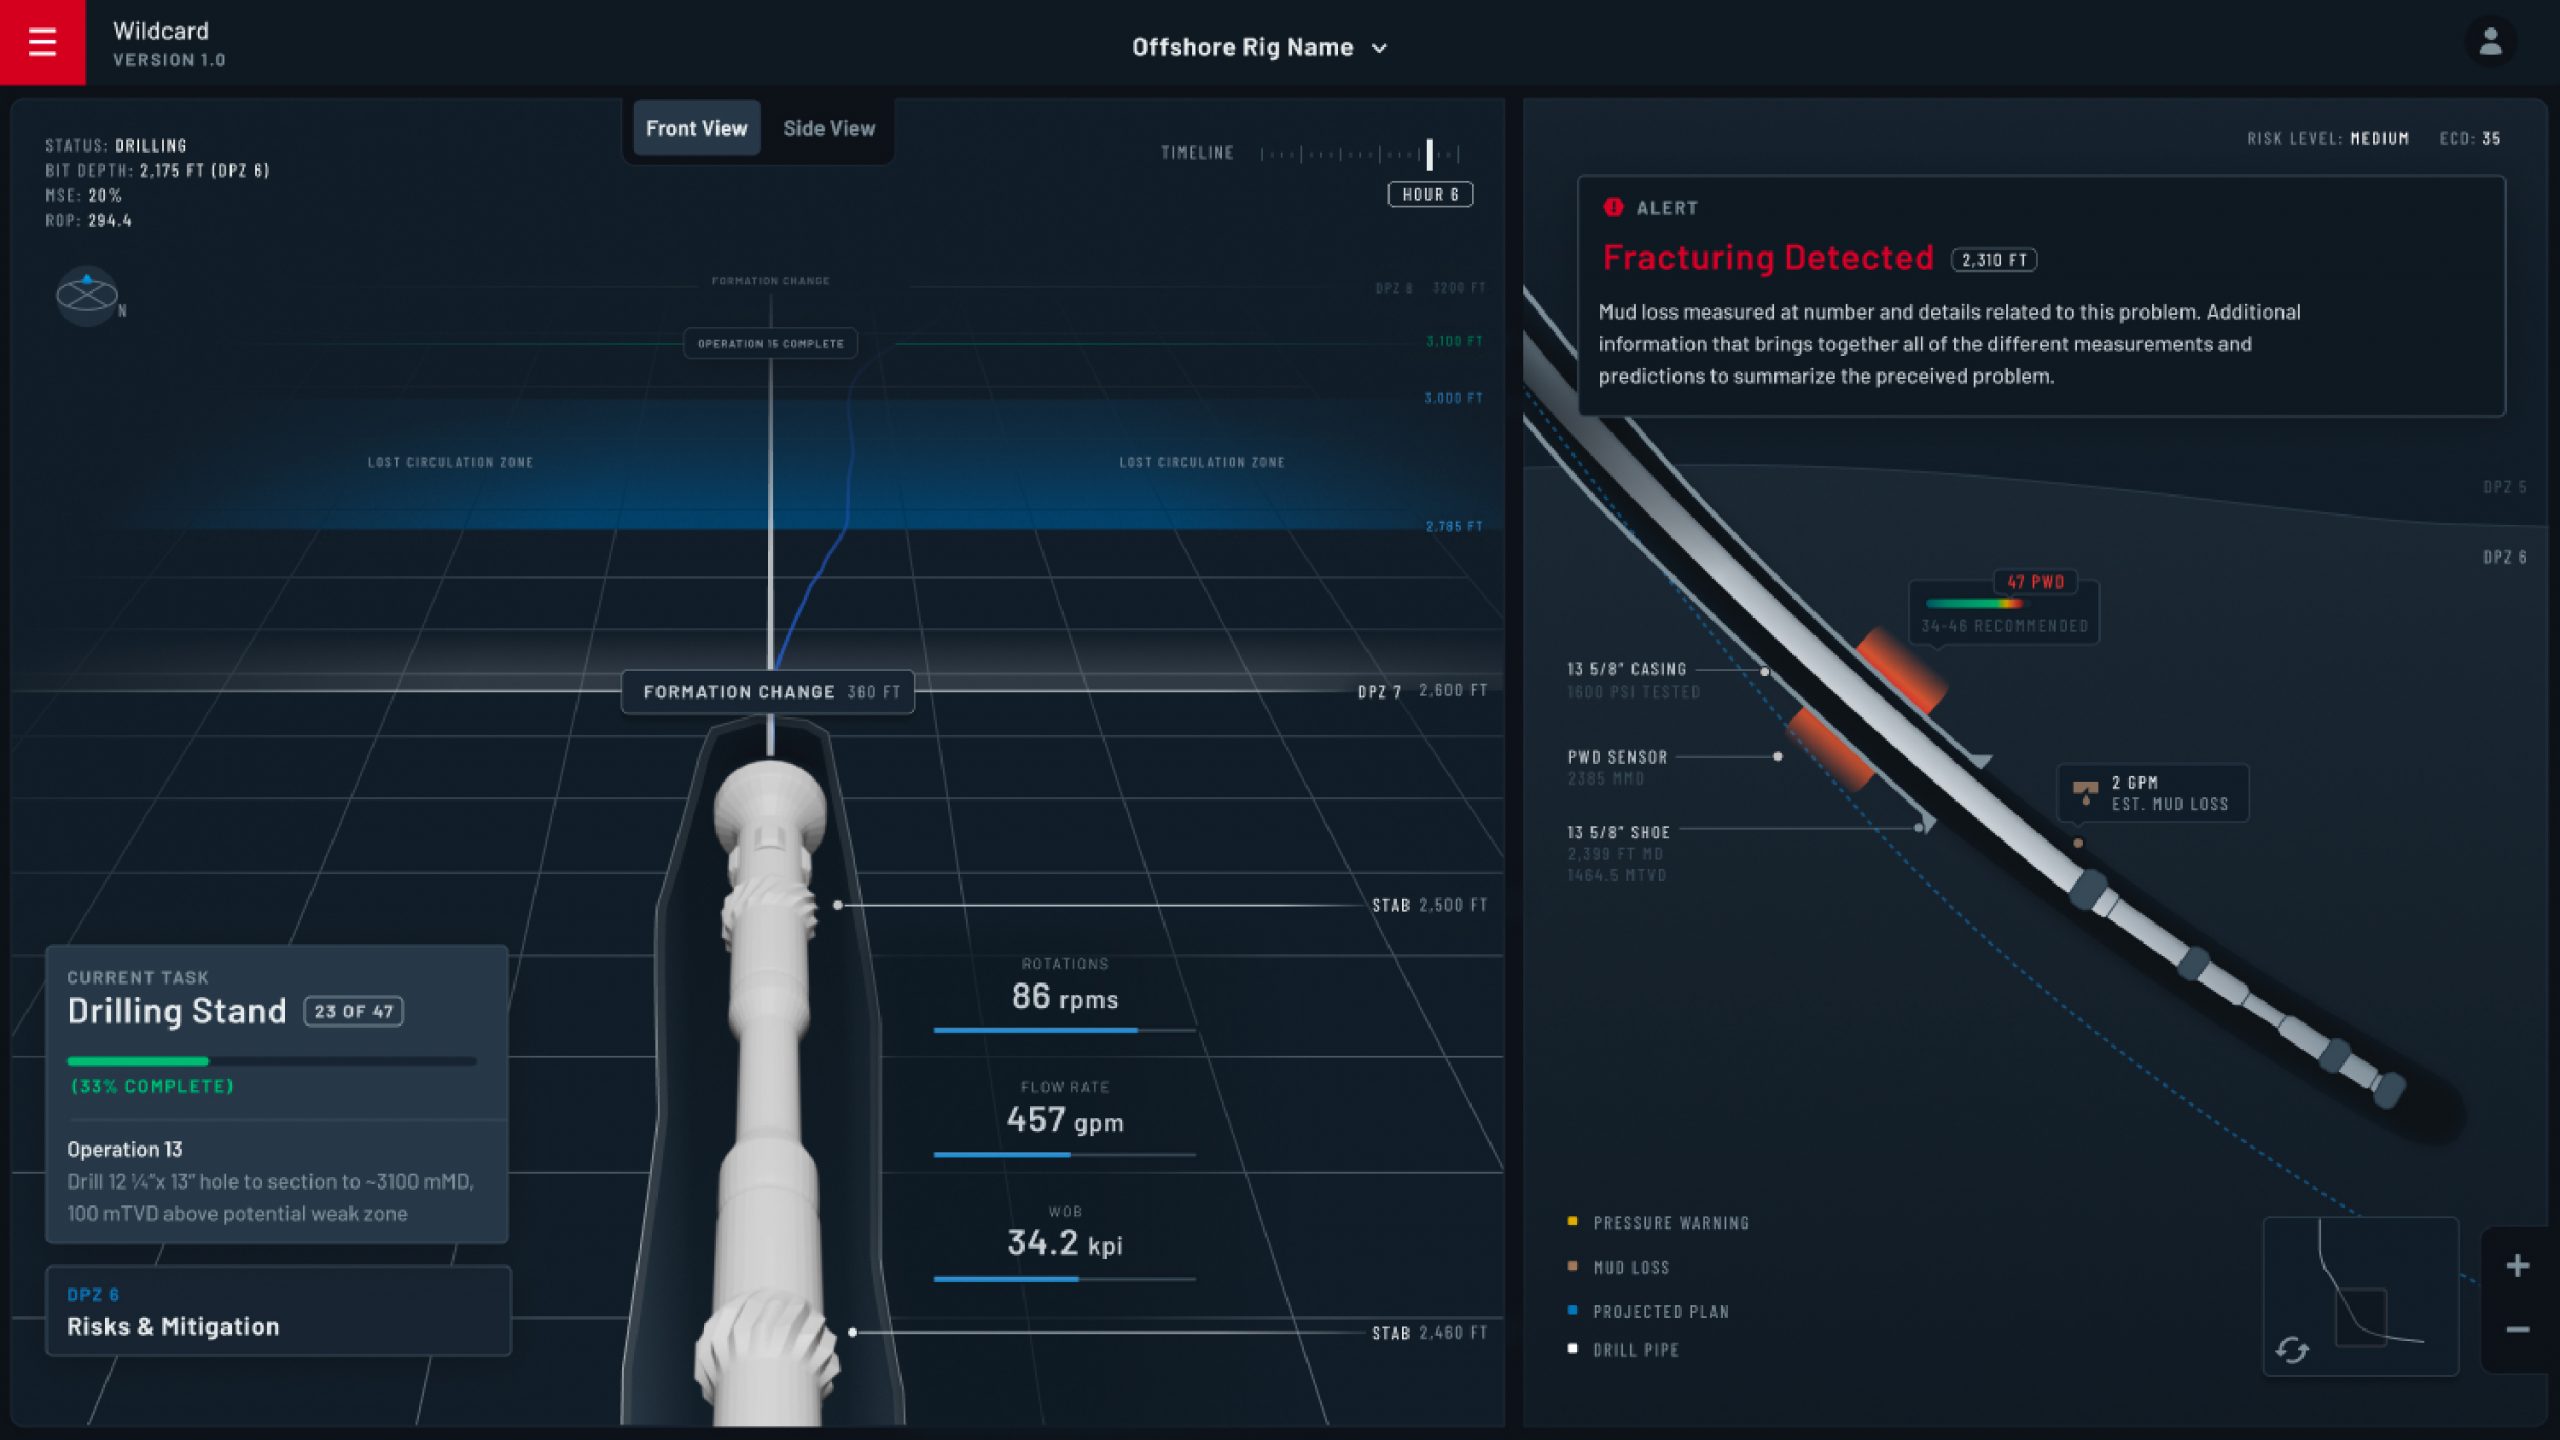
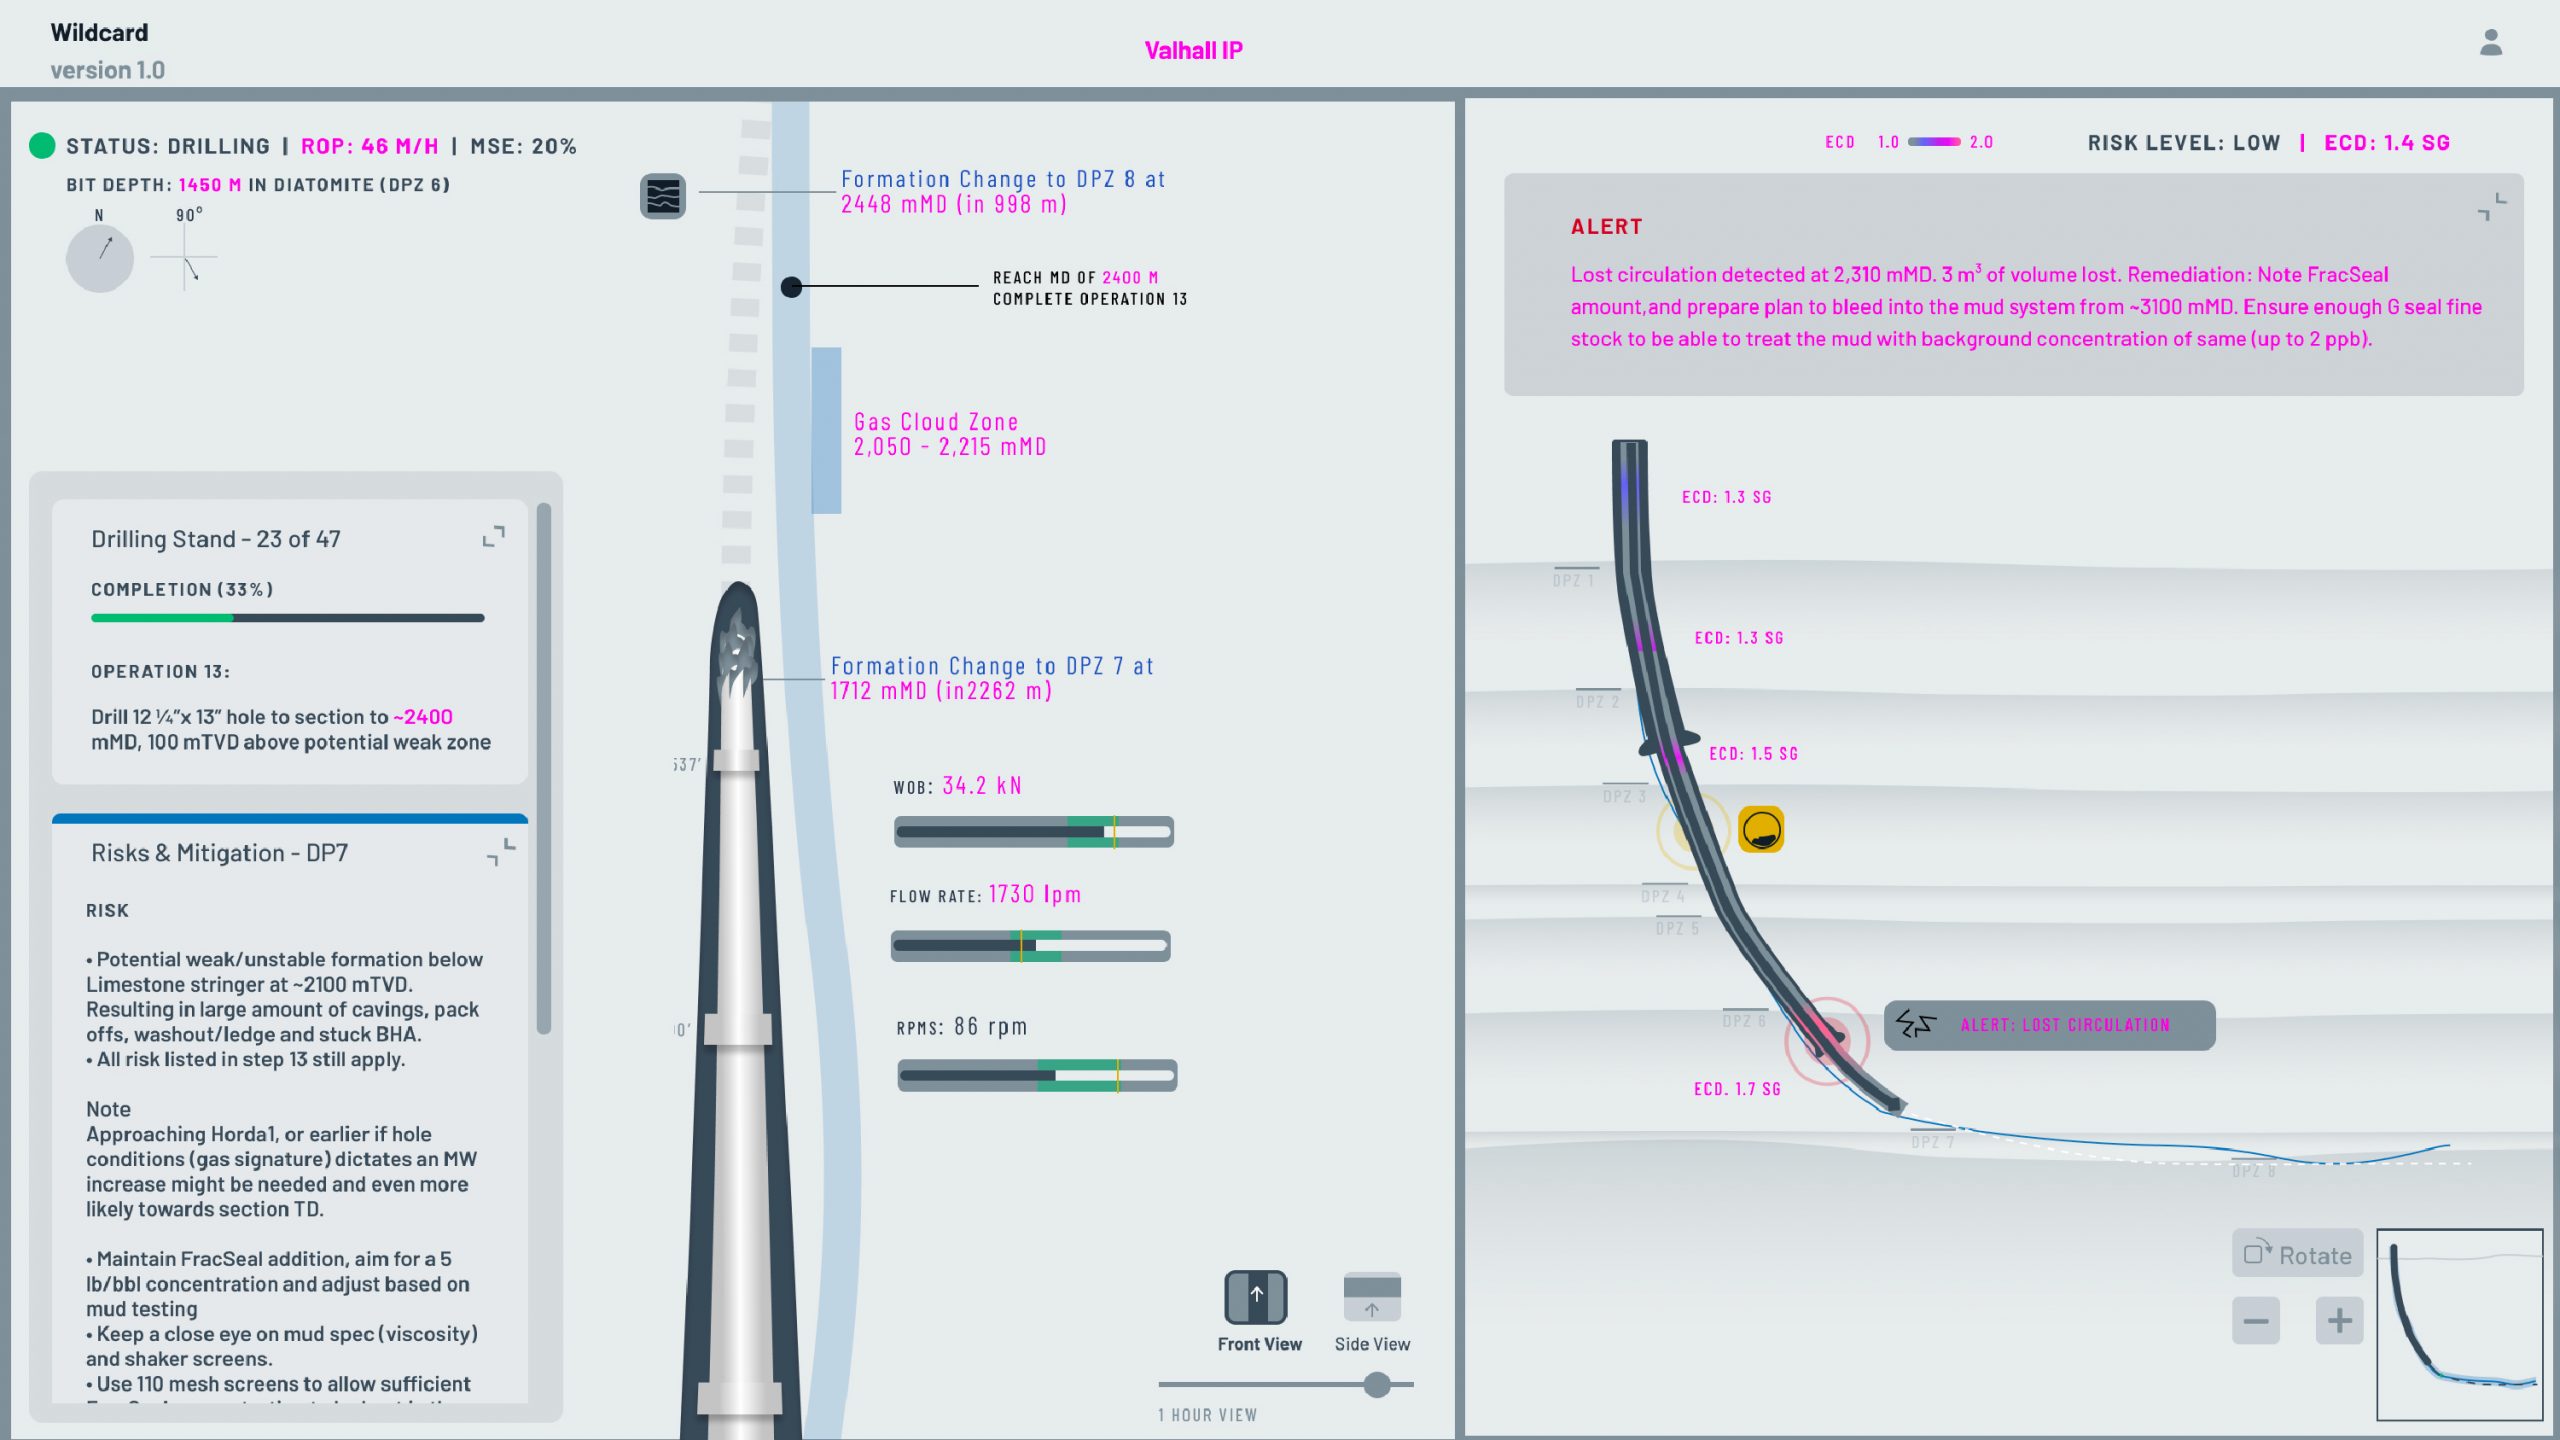
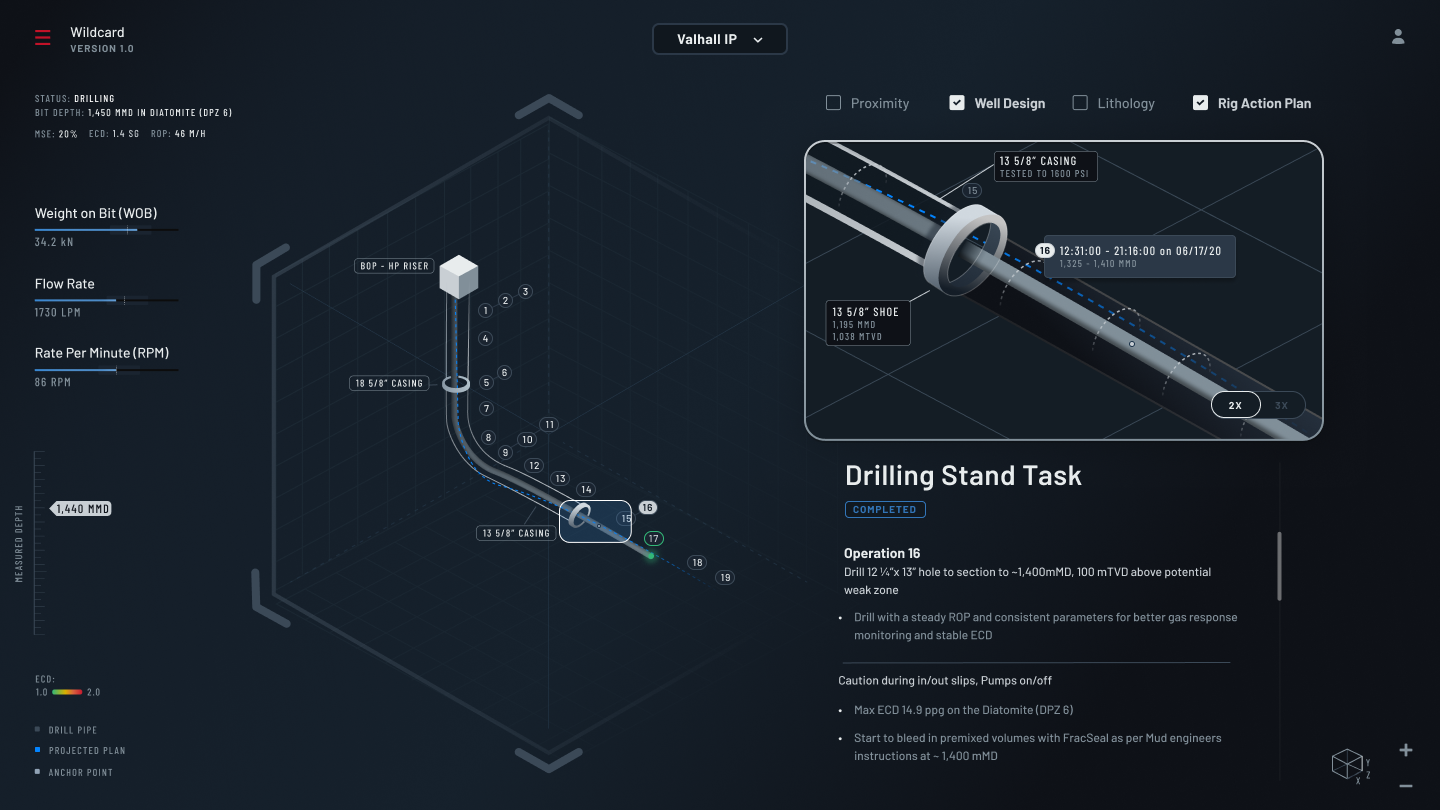
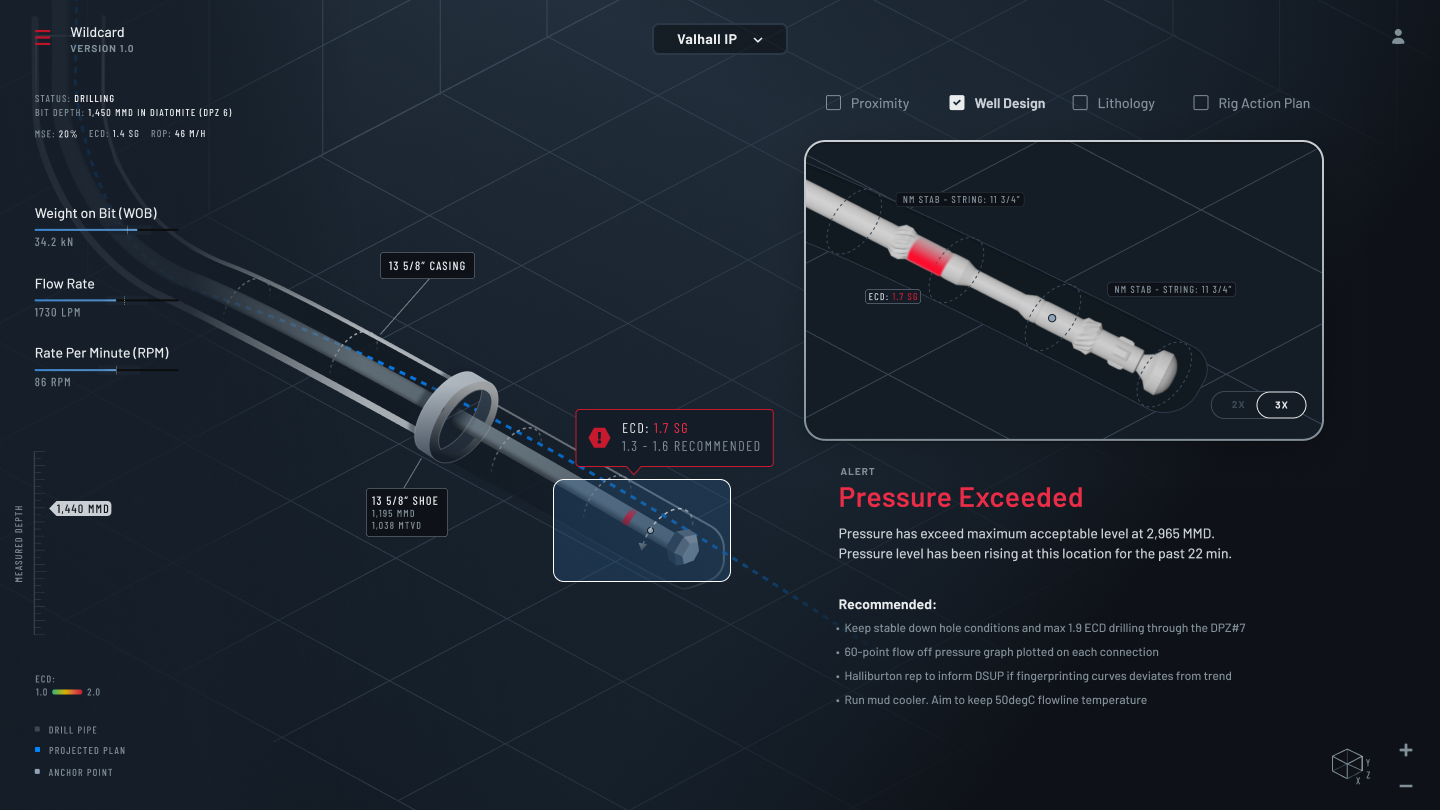
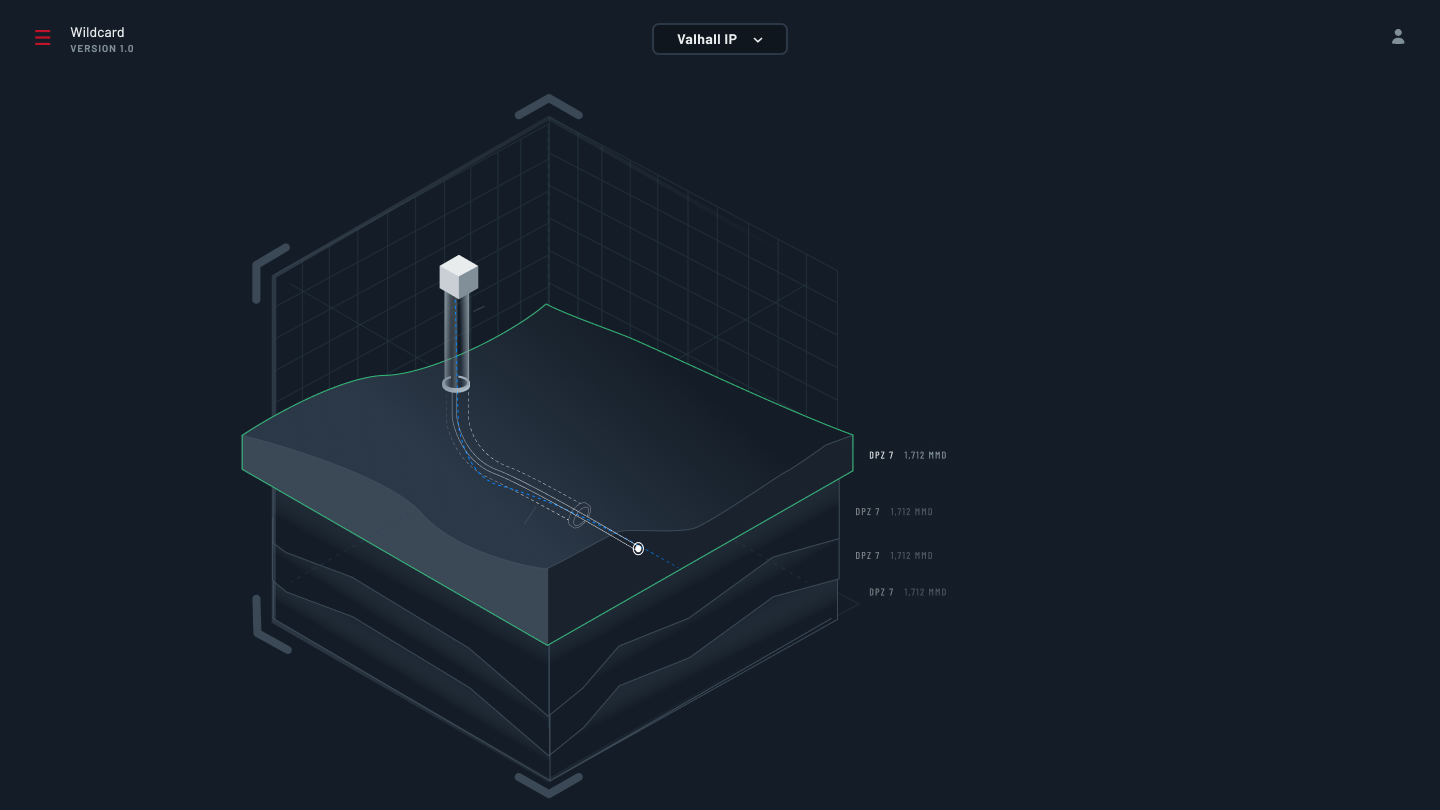
Rig Action Plan
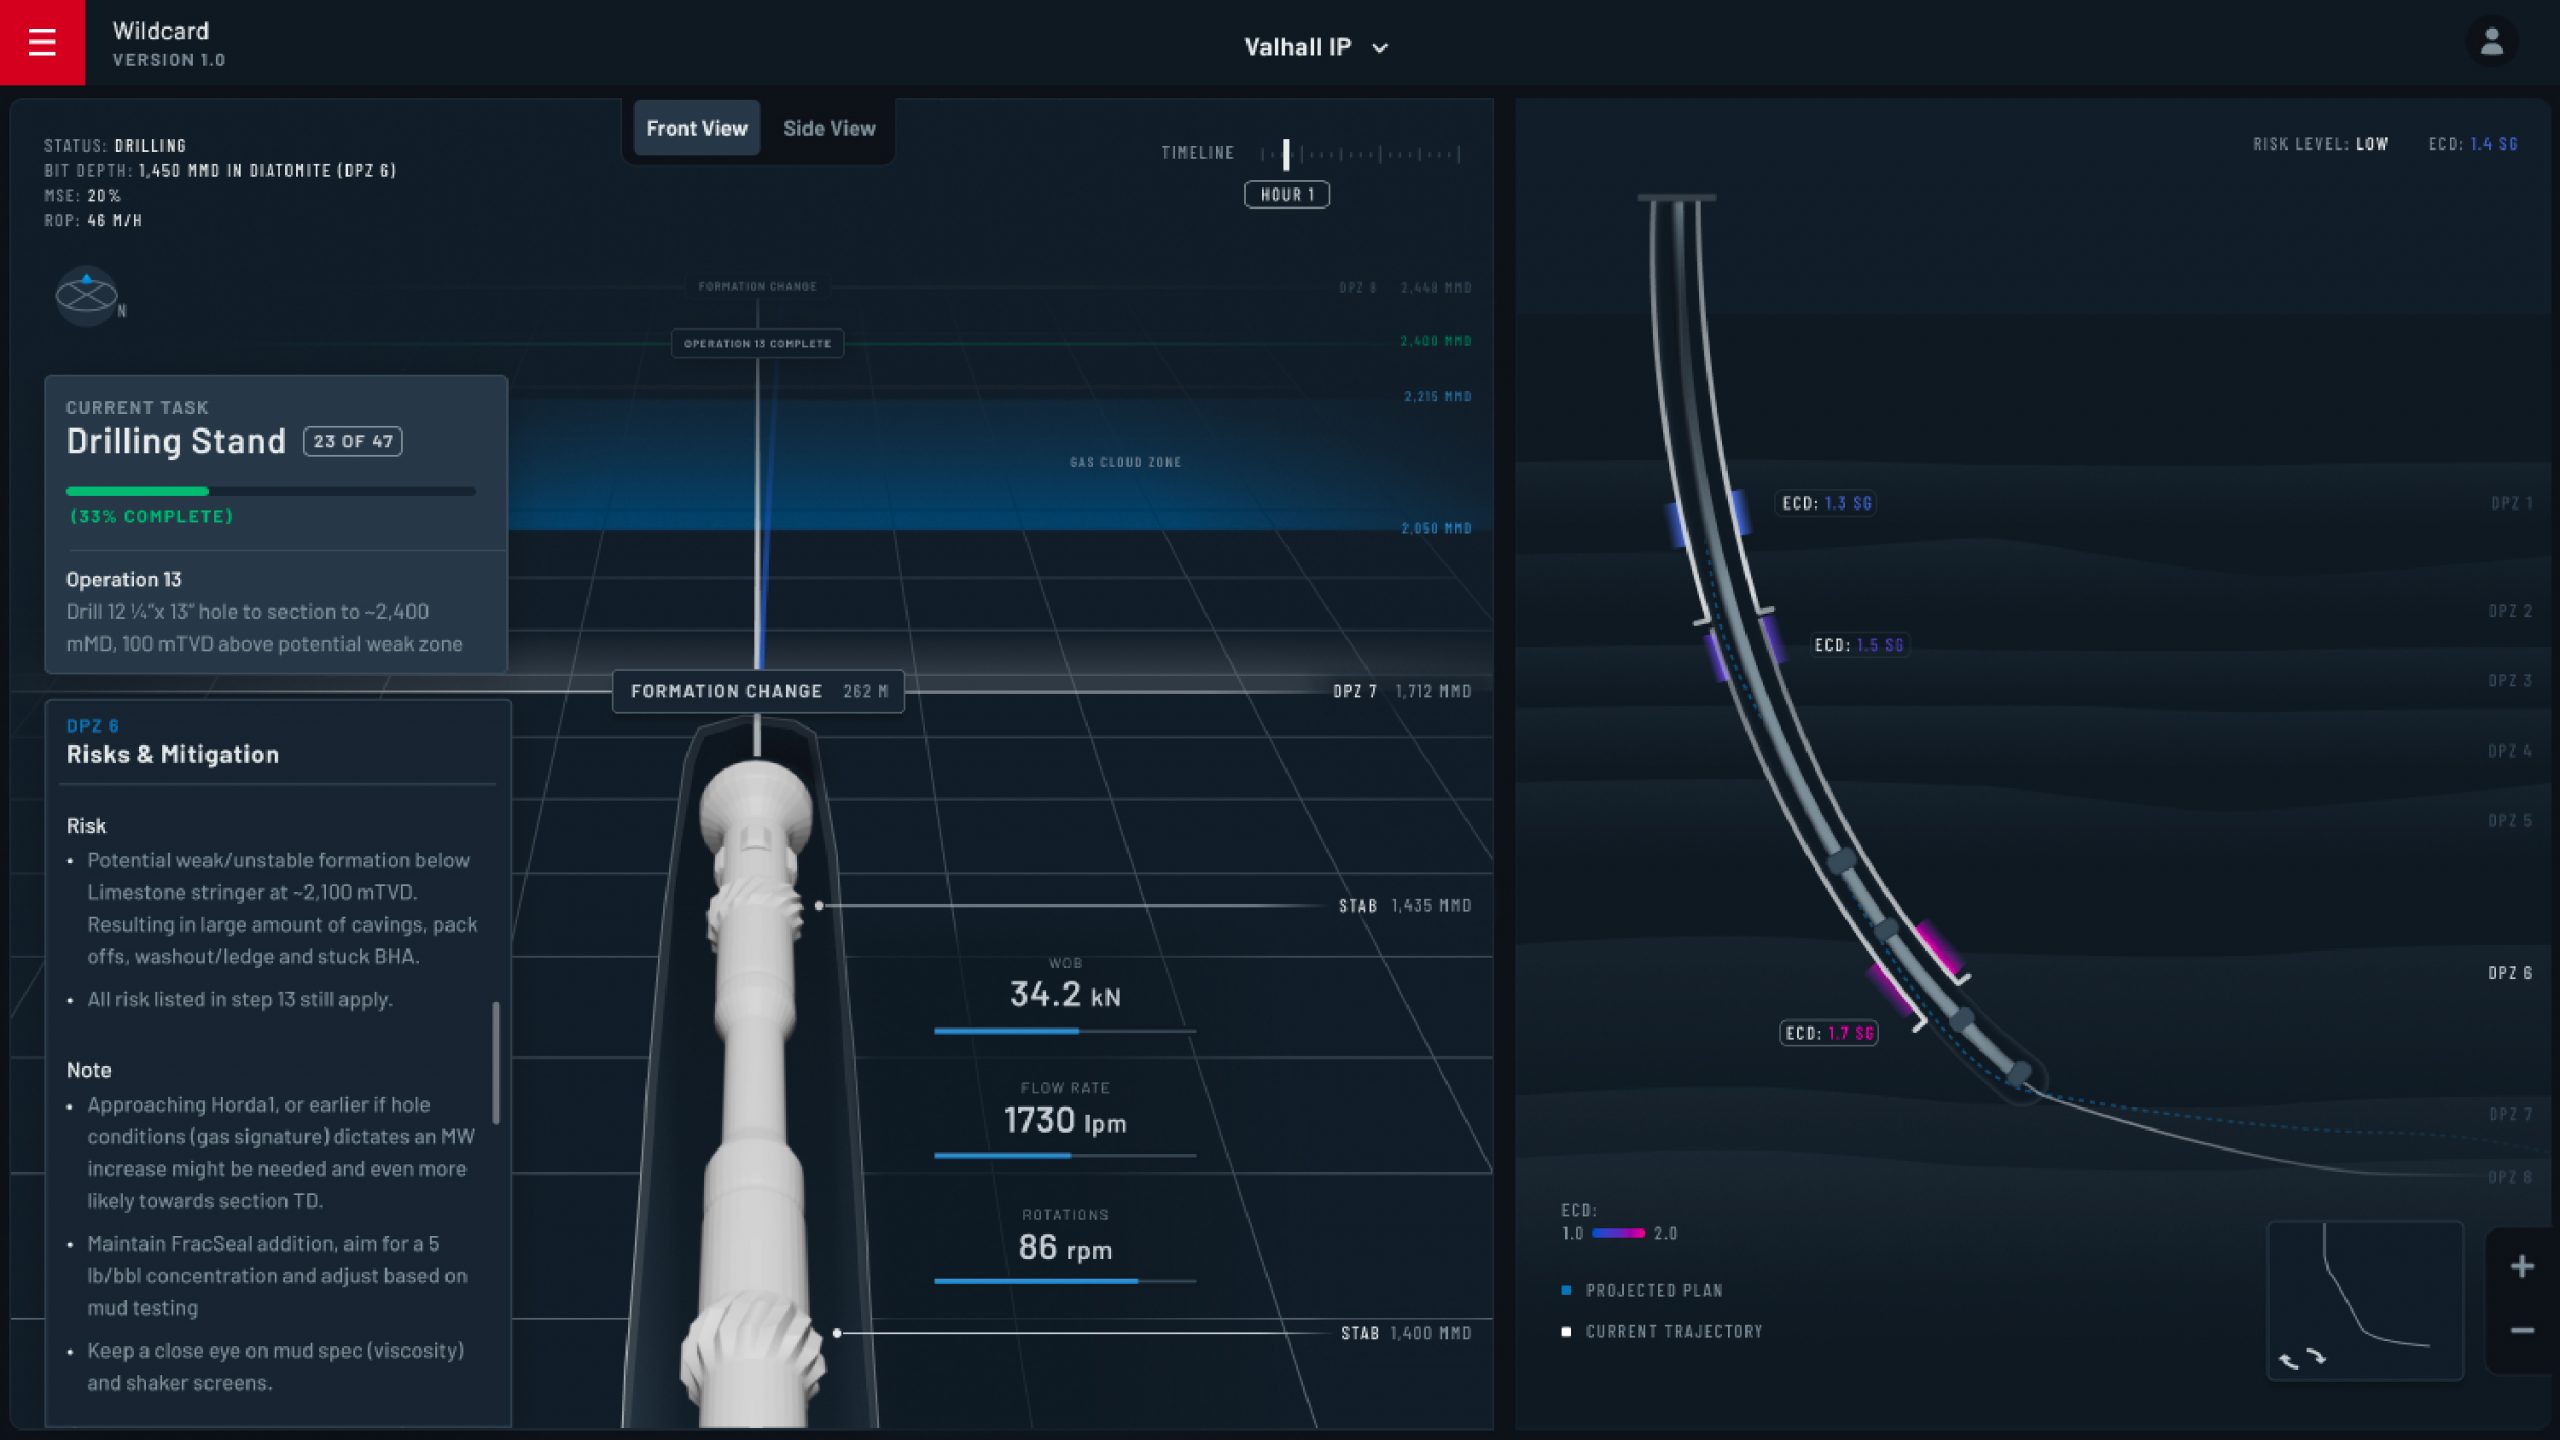
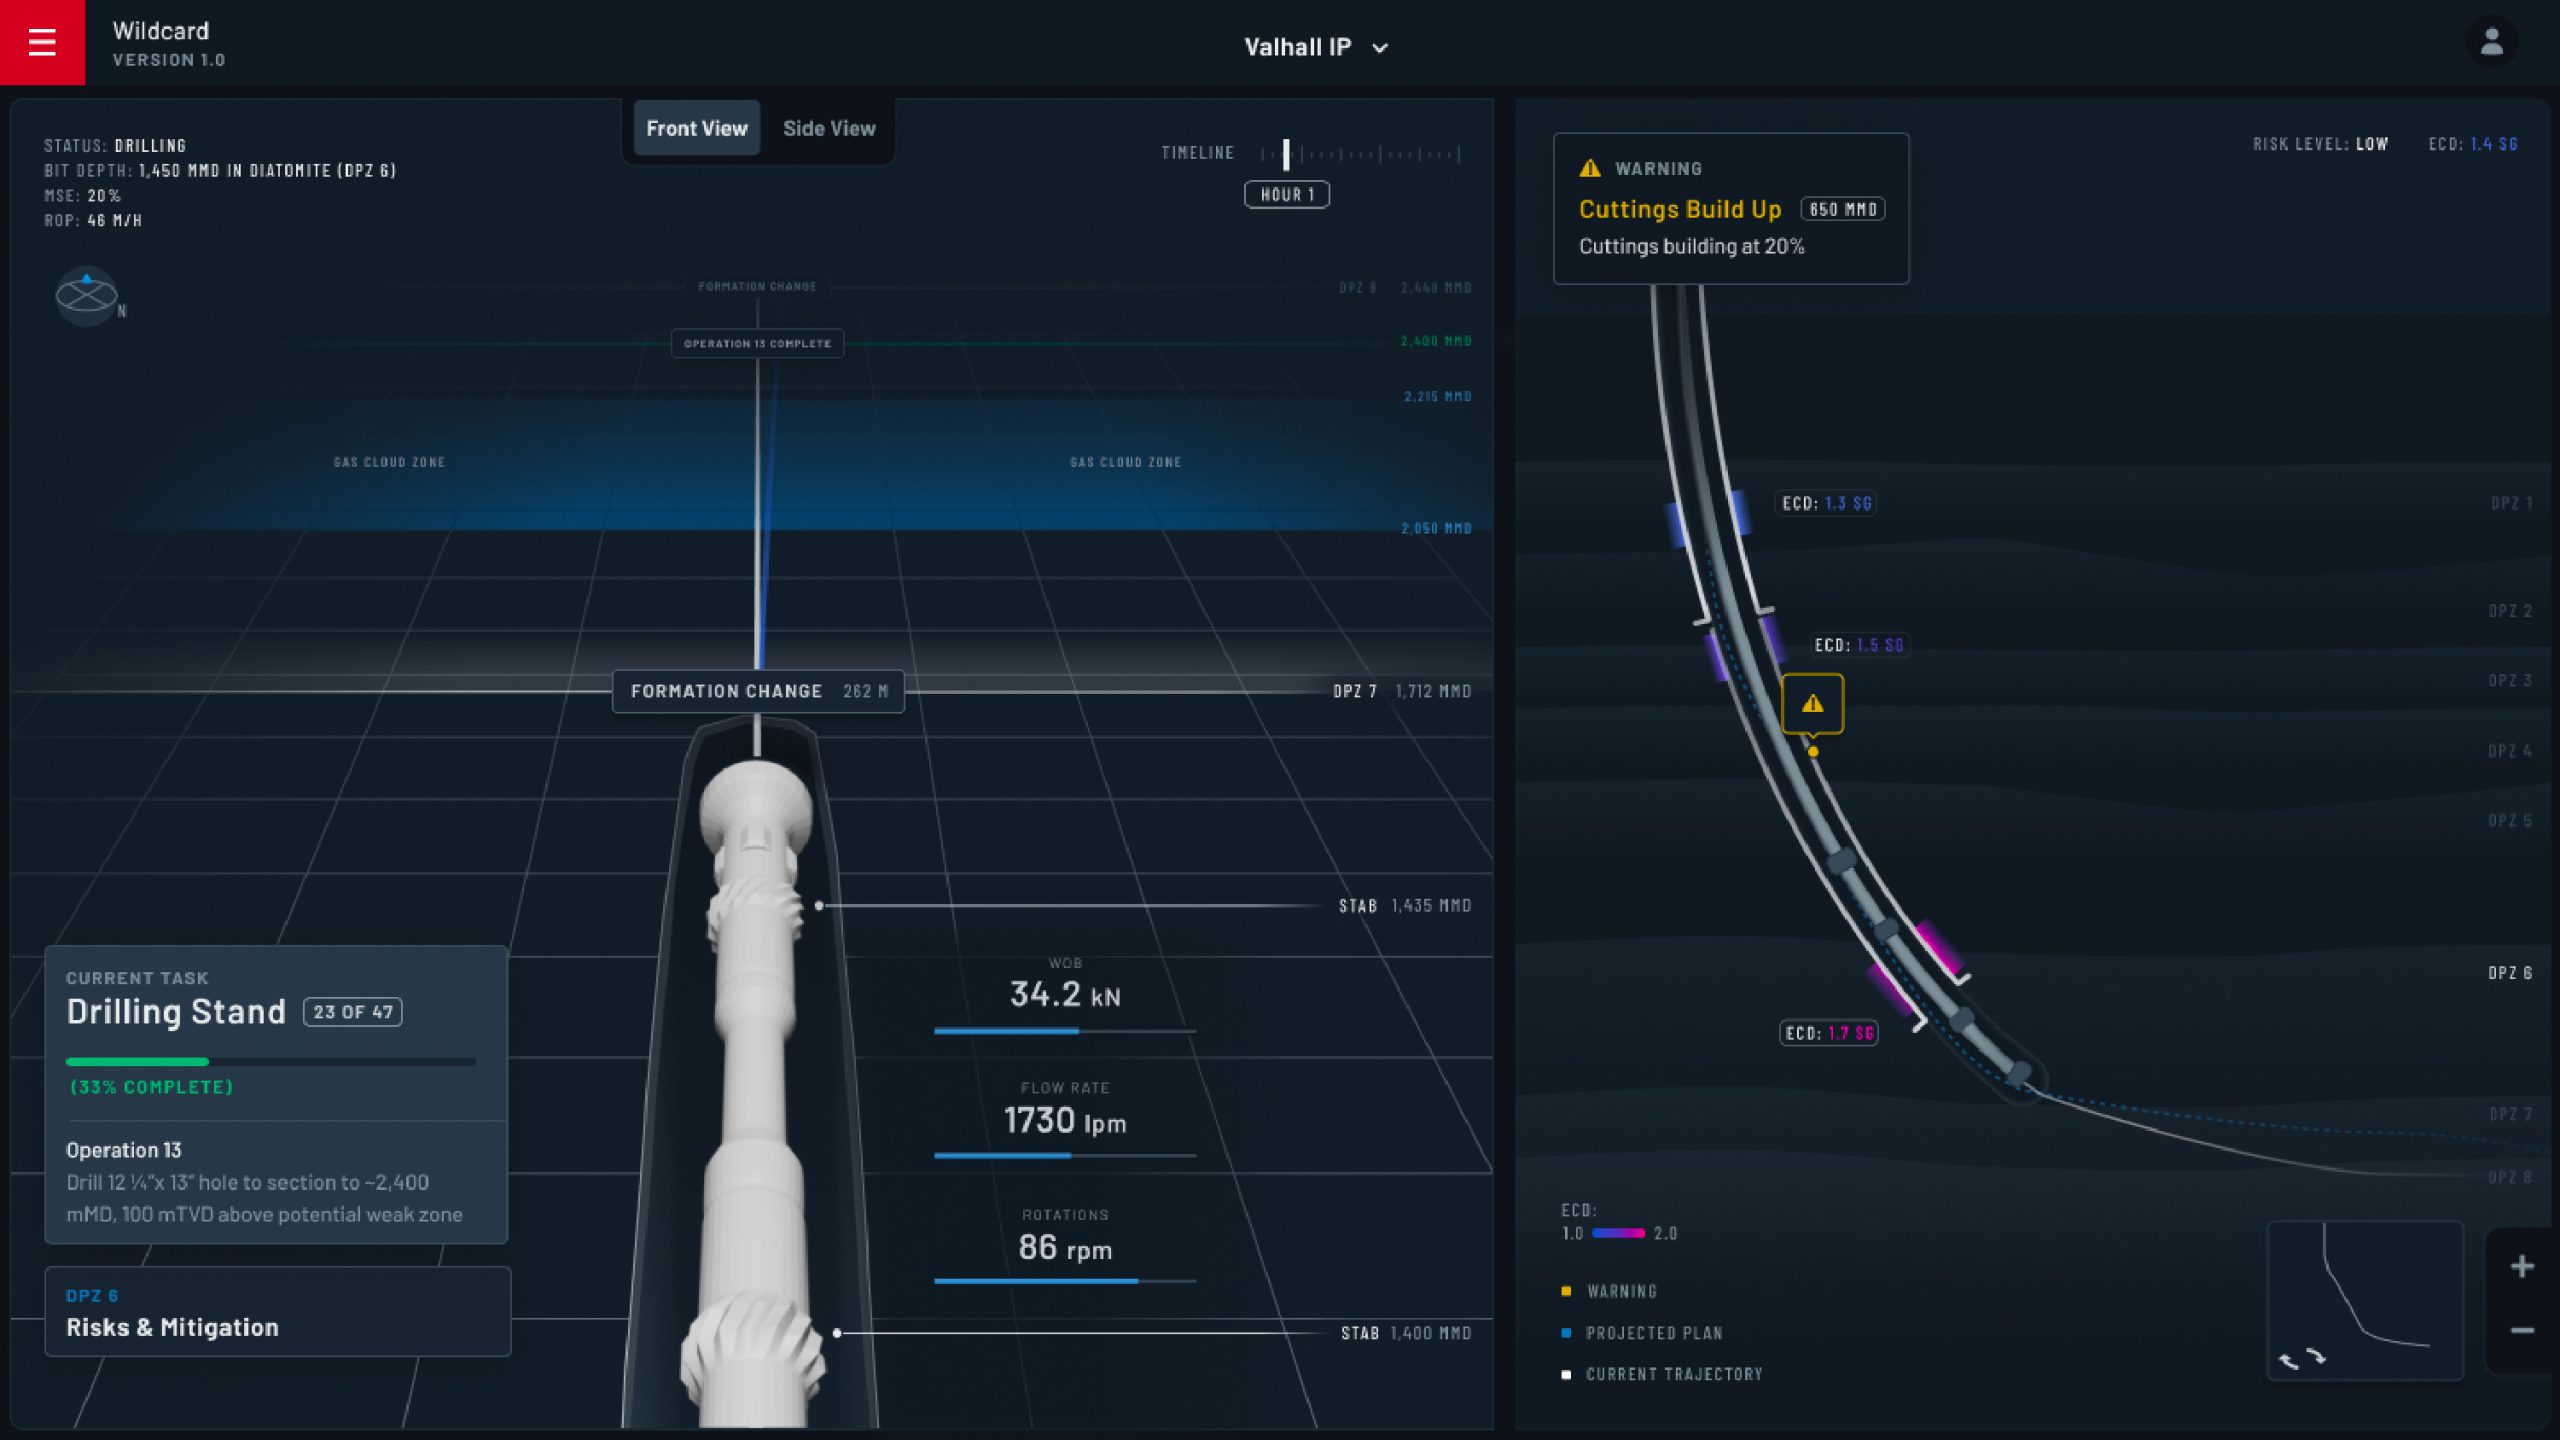
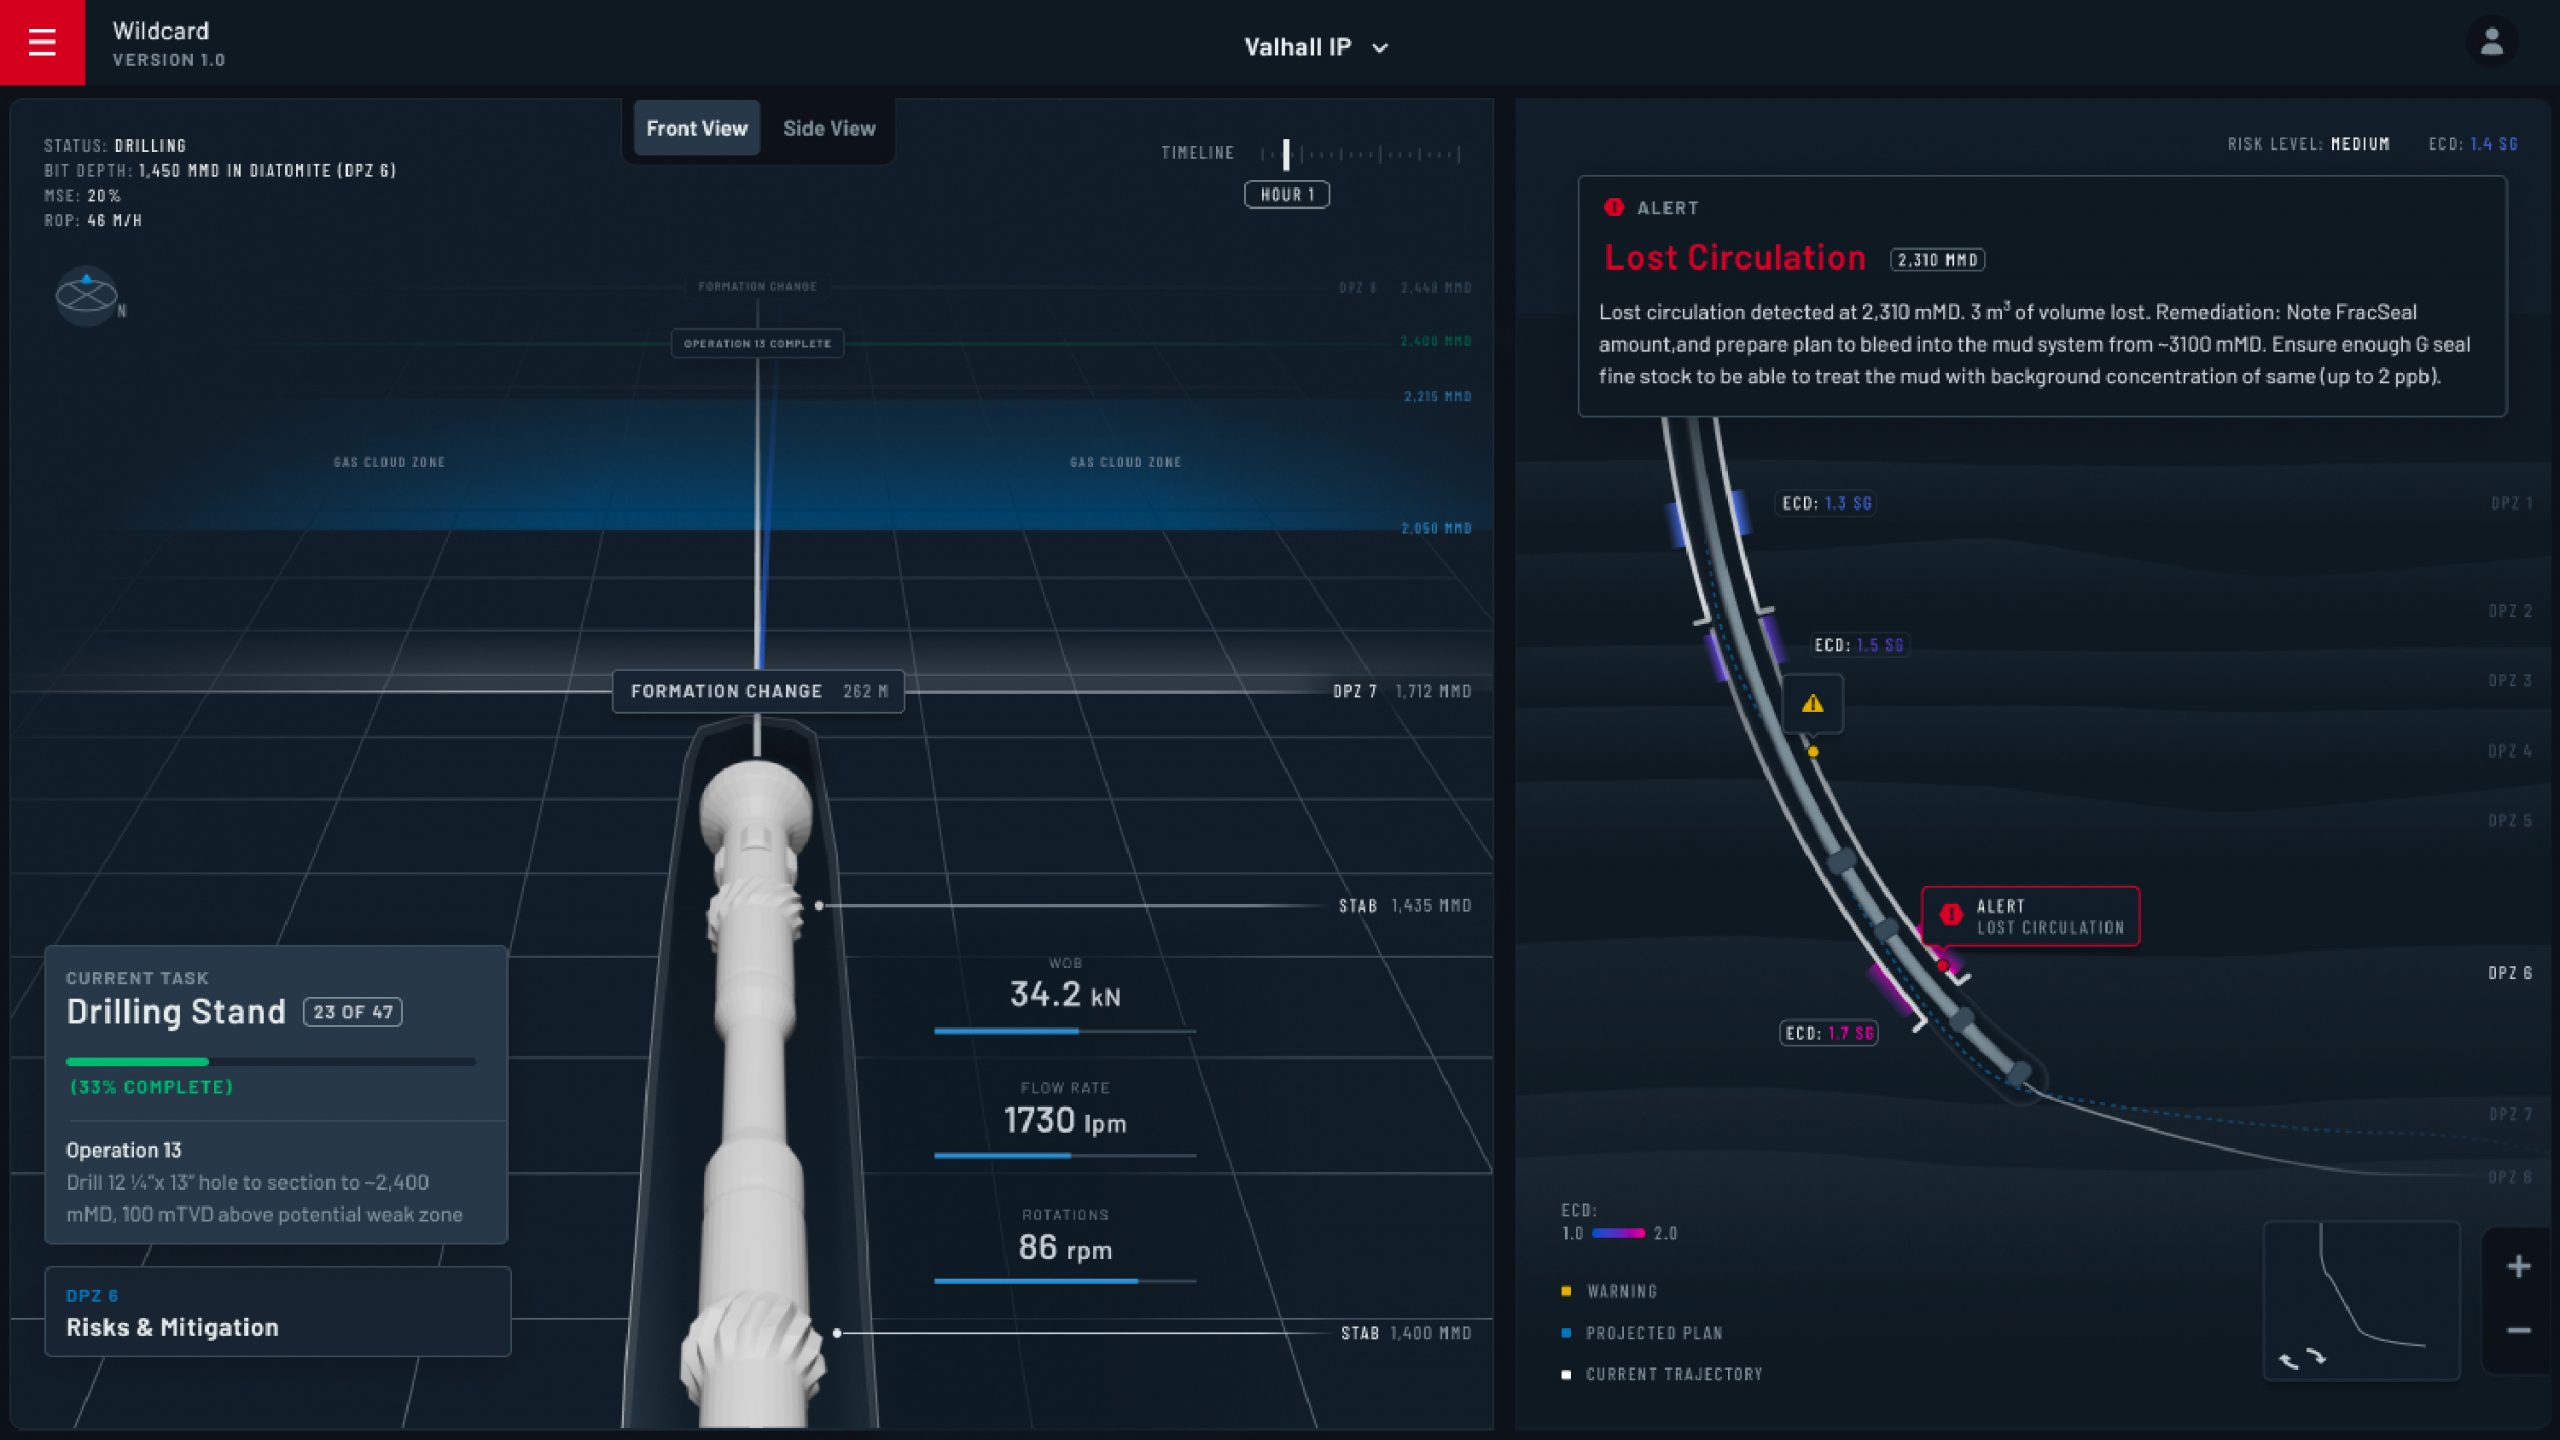
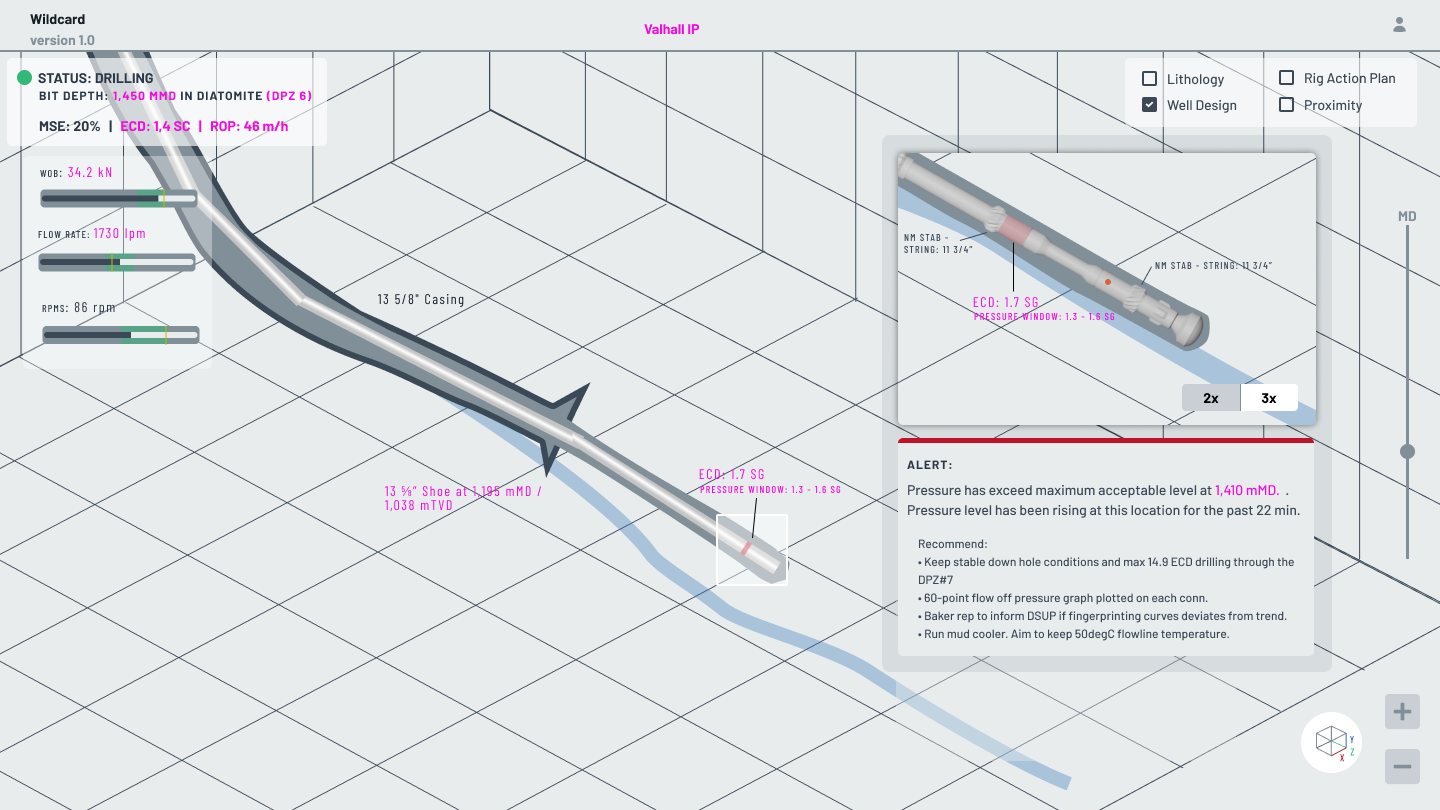
Fracturing detected at 2,310 MMD. Mud loss messured at number and details related to this problem. Additional information that brings together all of the different messurements and predictions to summarize the preceived problem.
week 4 - 5
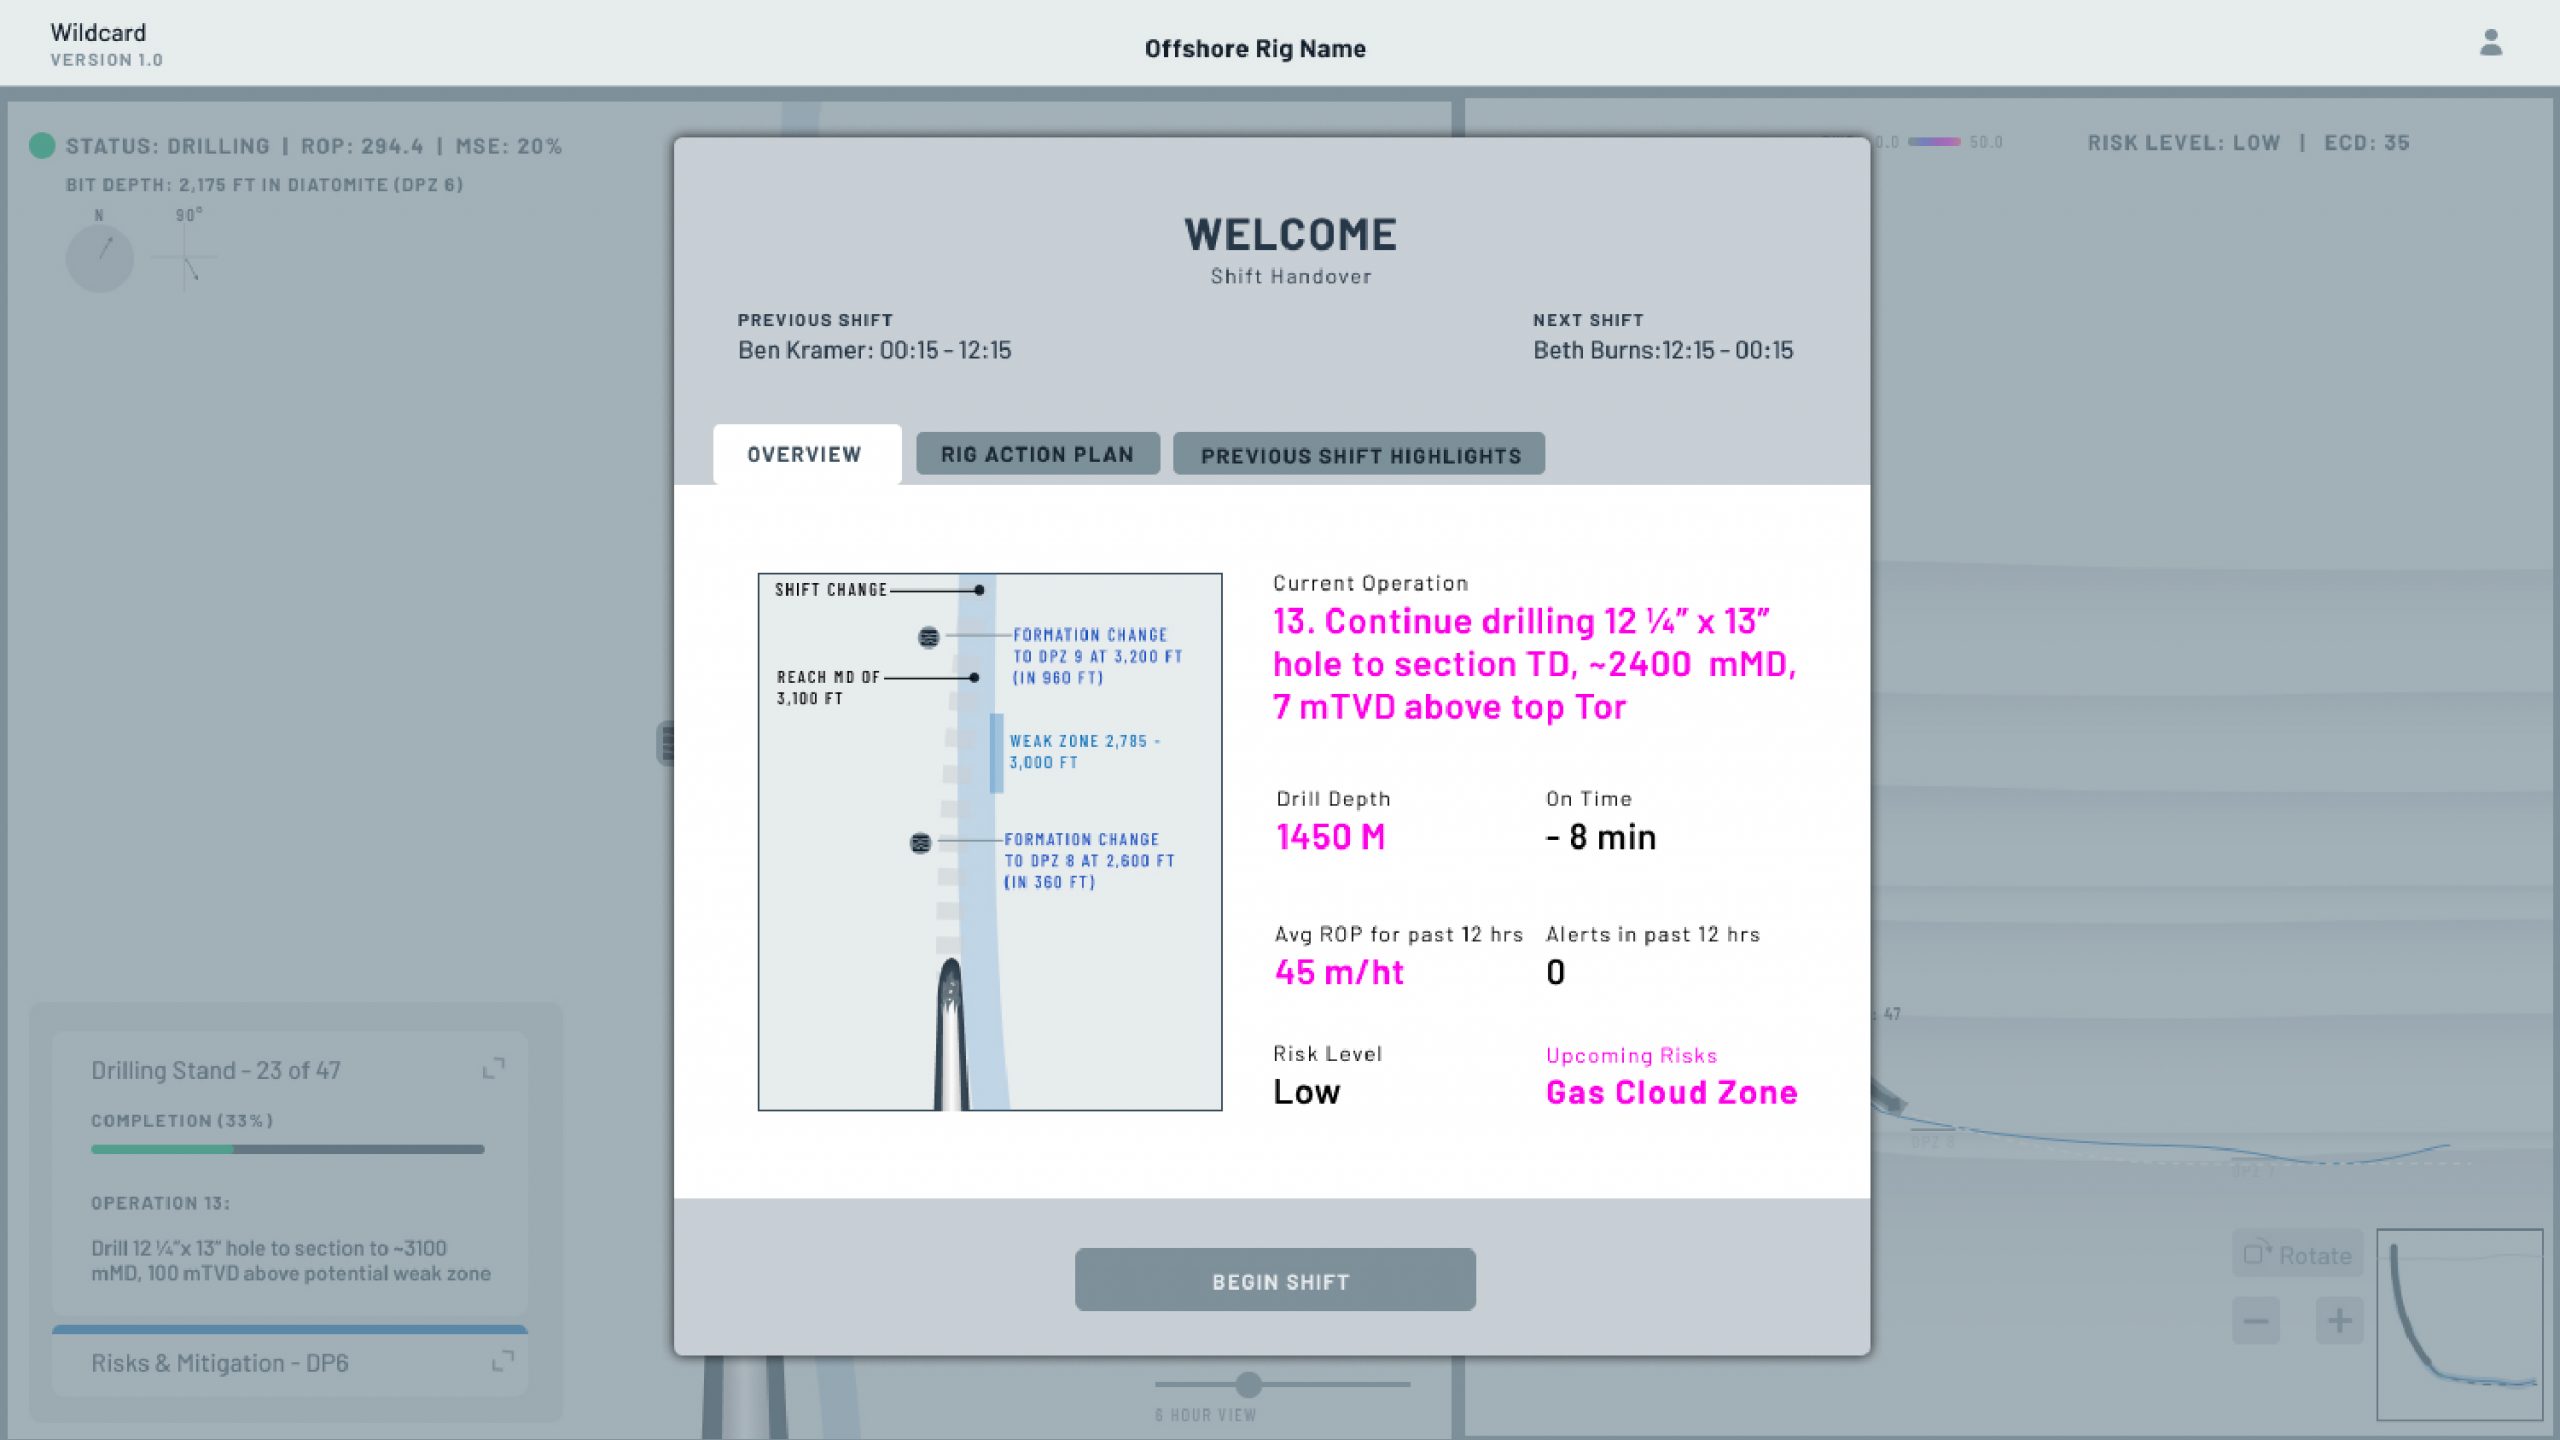
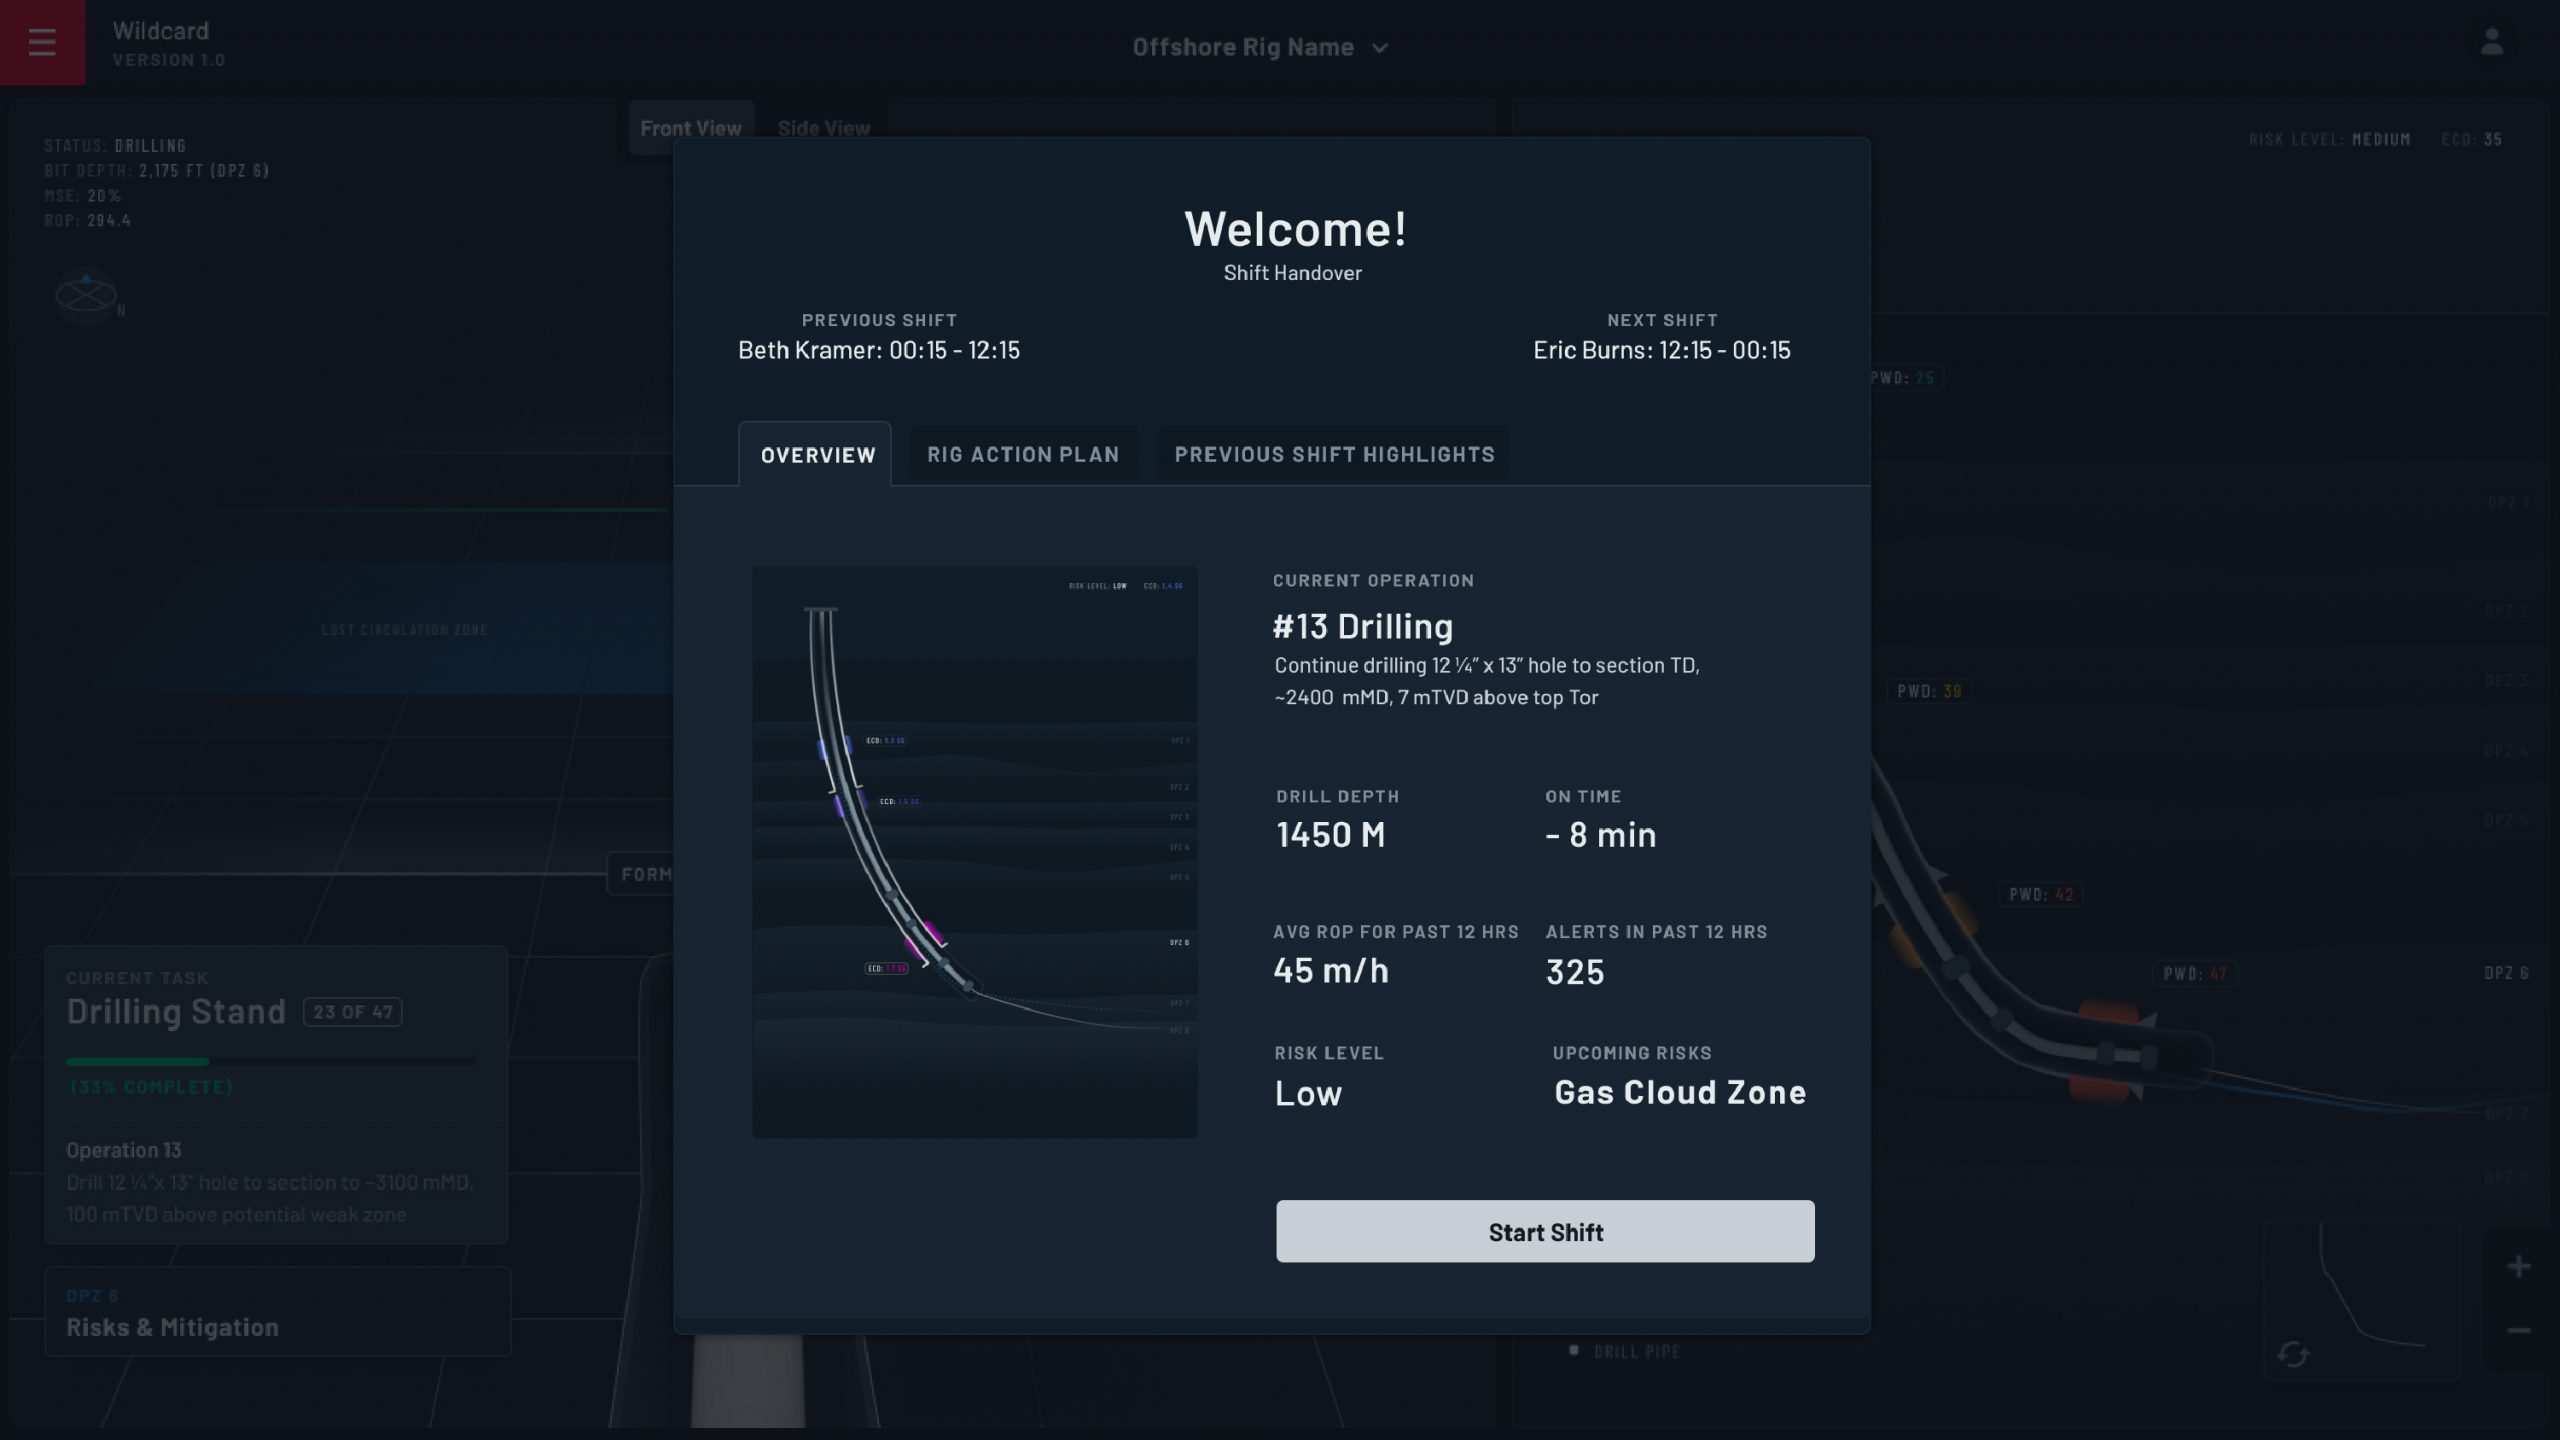
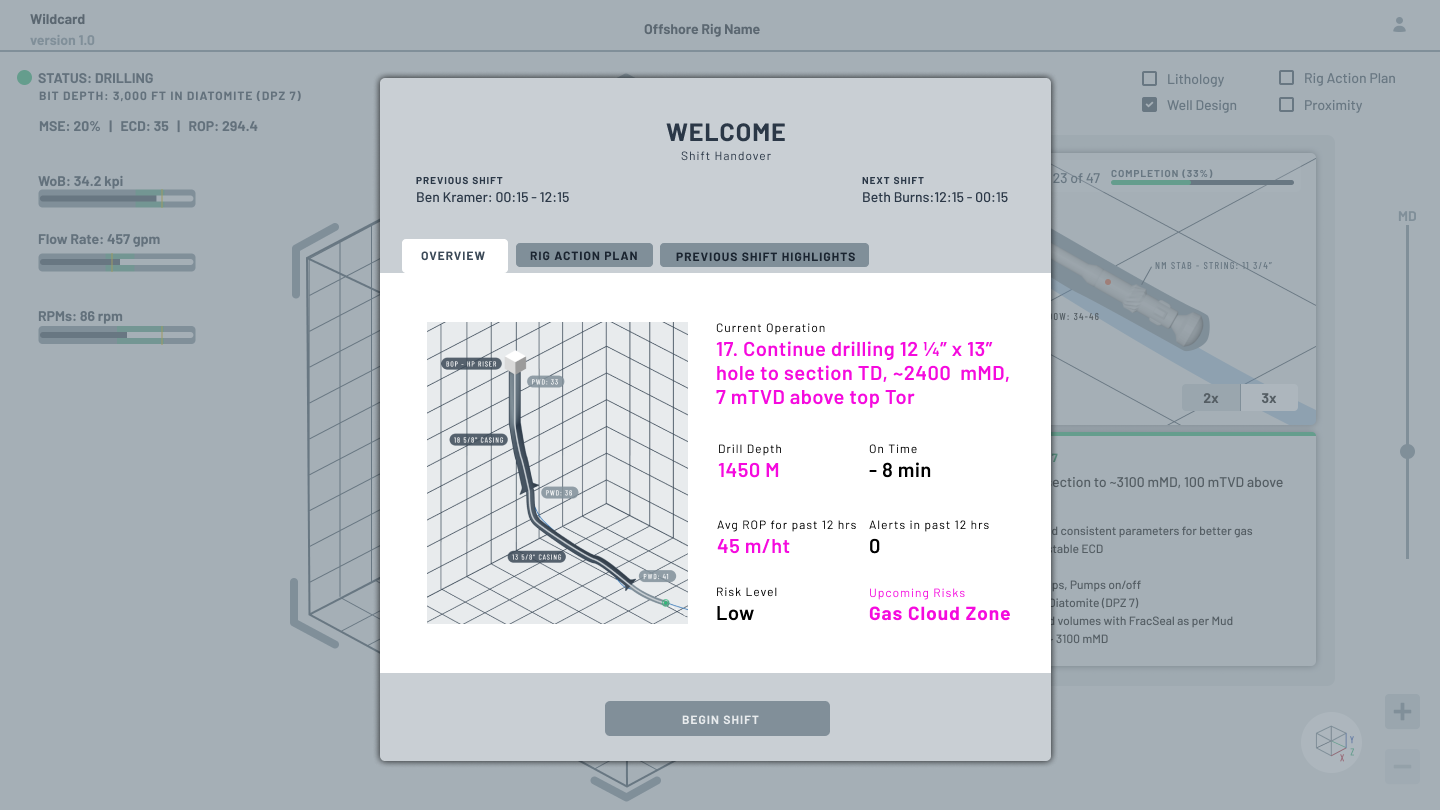
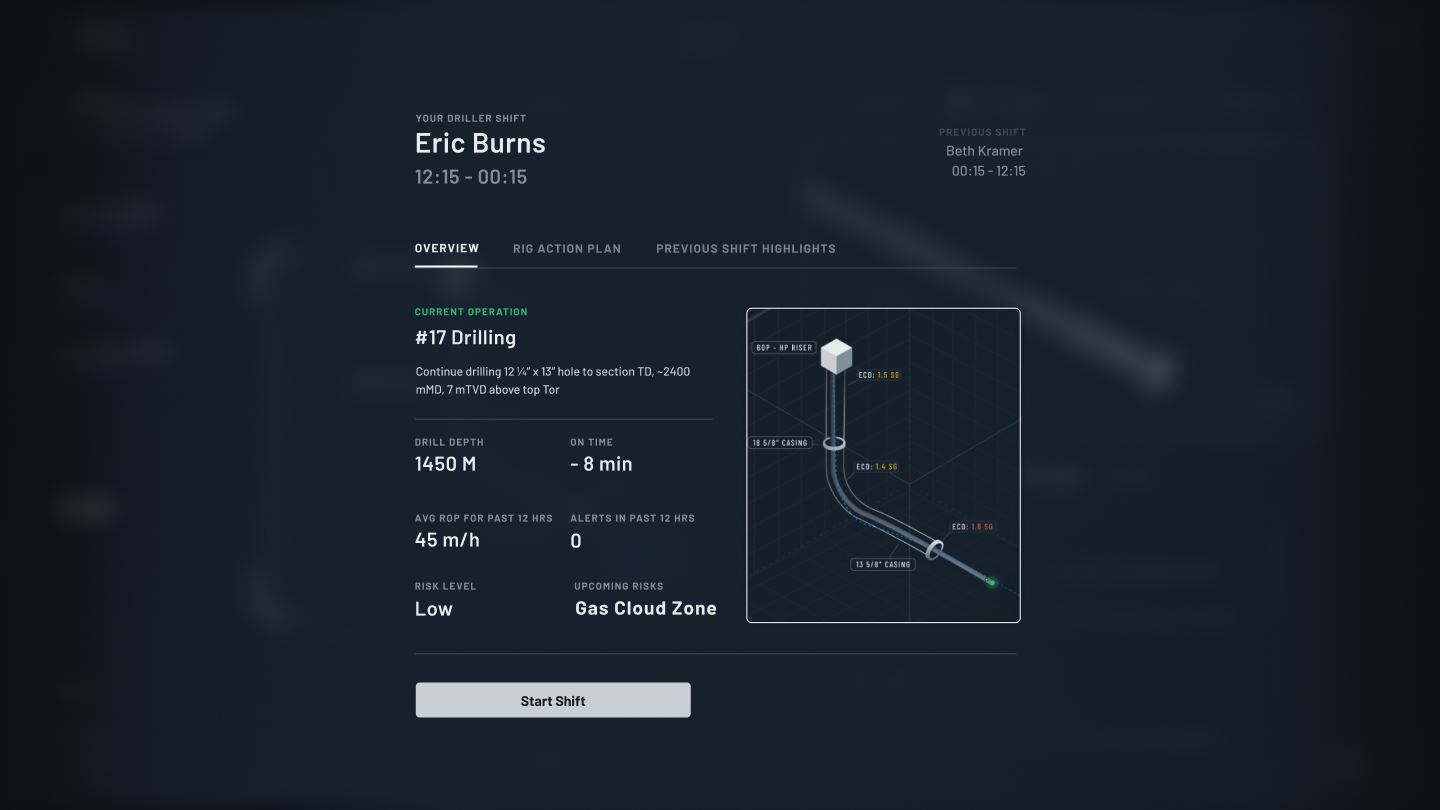
Shift handover process flow
Based on our user interviews, we identified some key issues to be aware of:
• Did not clearly define responsibilities and information needs.
• Did not provide written guidance.
• Did not mention it in their safety case.
• Lacked risk awareness among their operators.
• Provided little or no training.
• Did little monitoring or auditing.
• Had accidents that involved miscommunication at shift handover, e.g., maintenance or plant status.
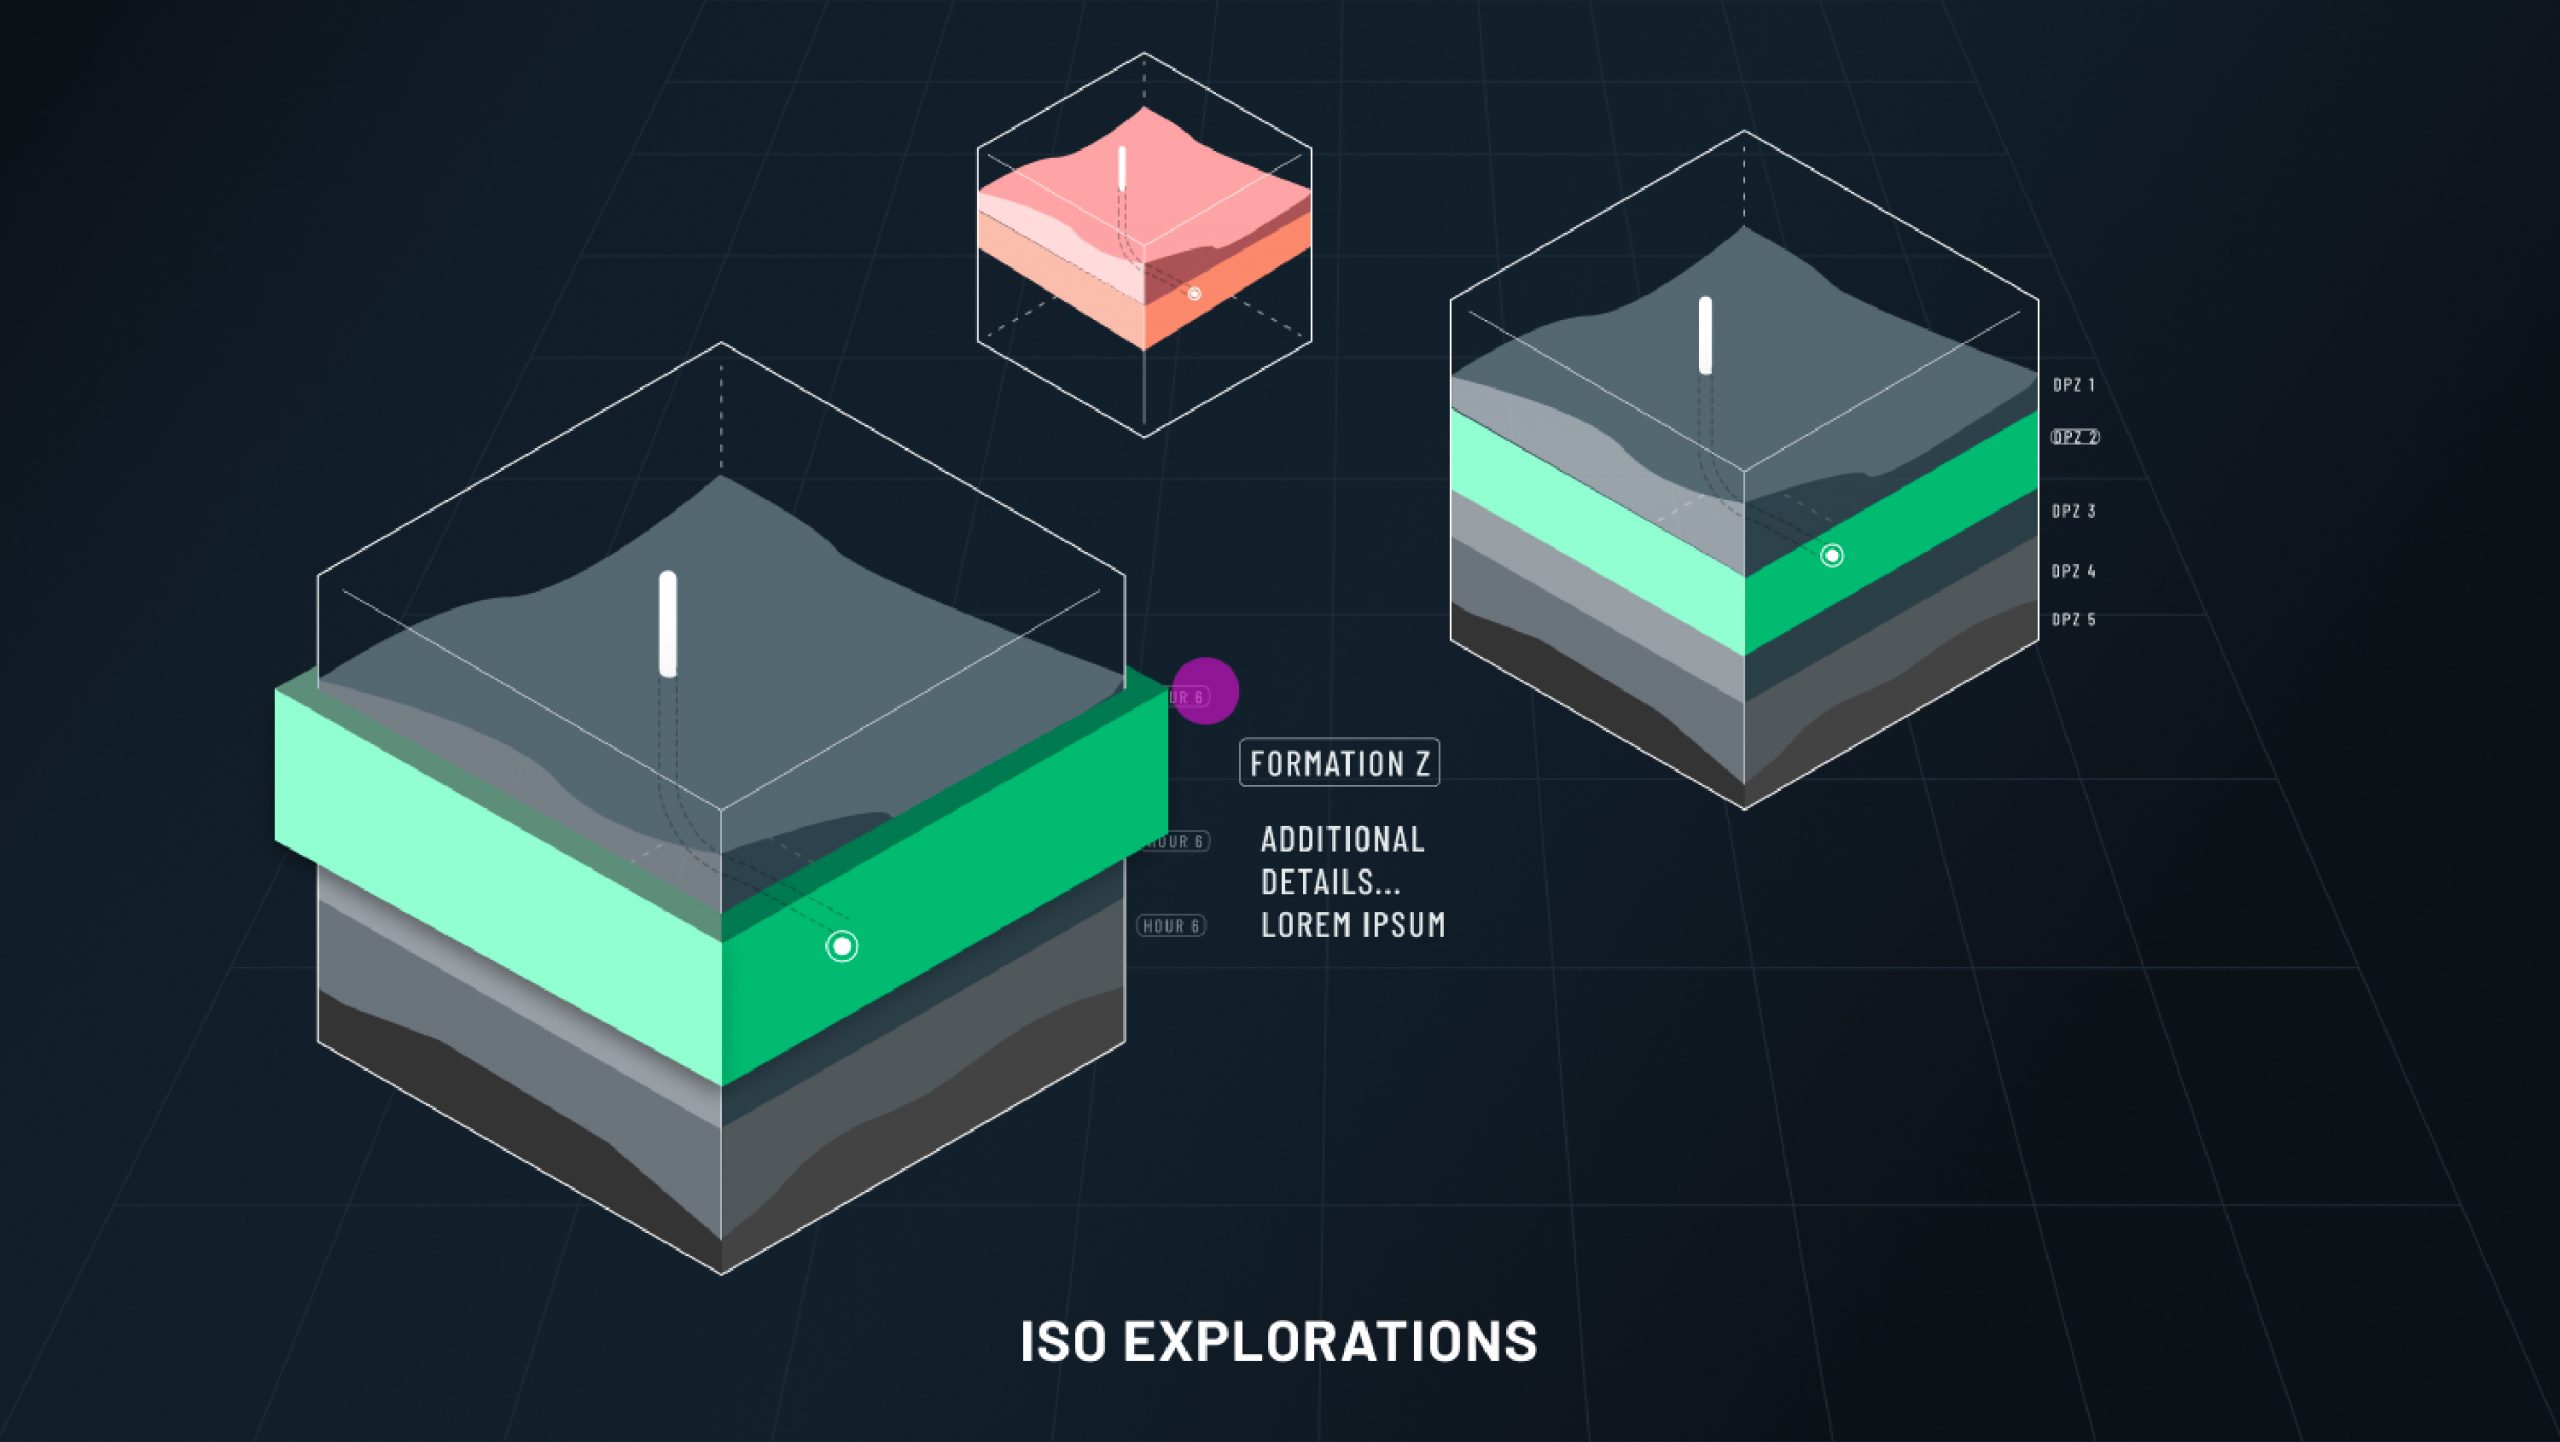
week 6
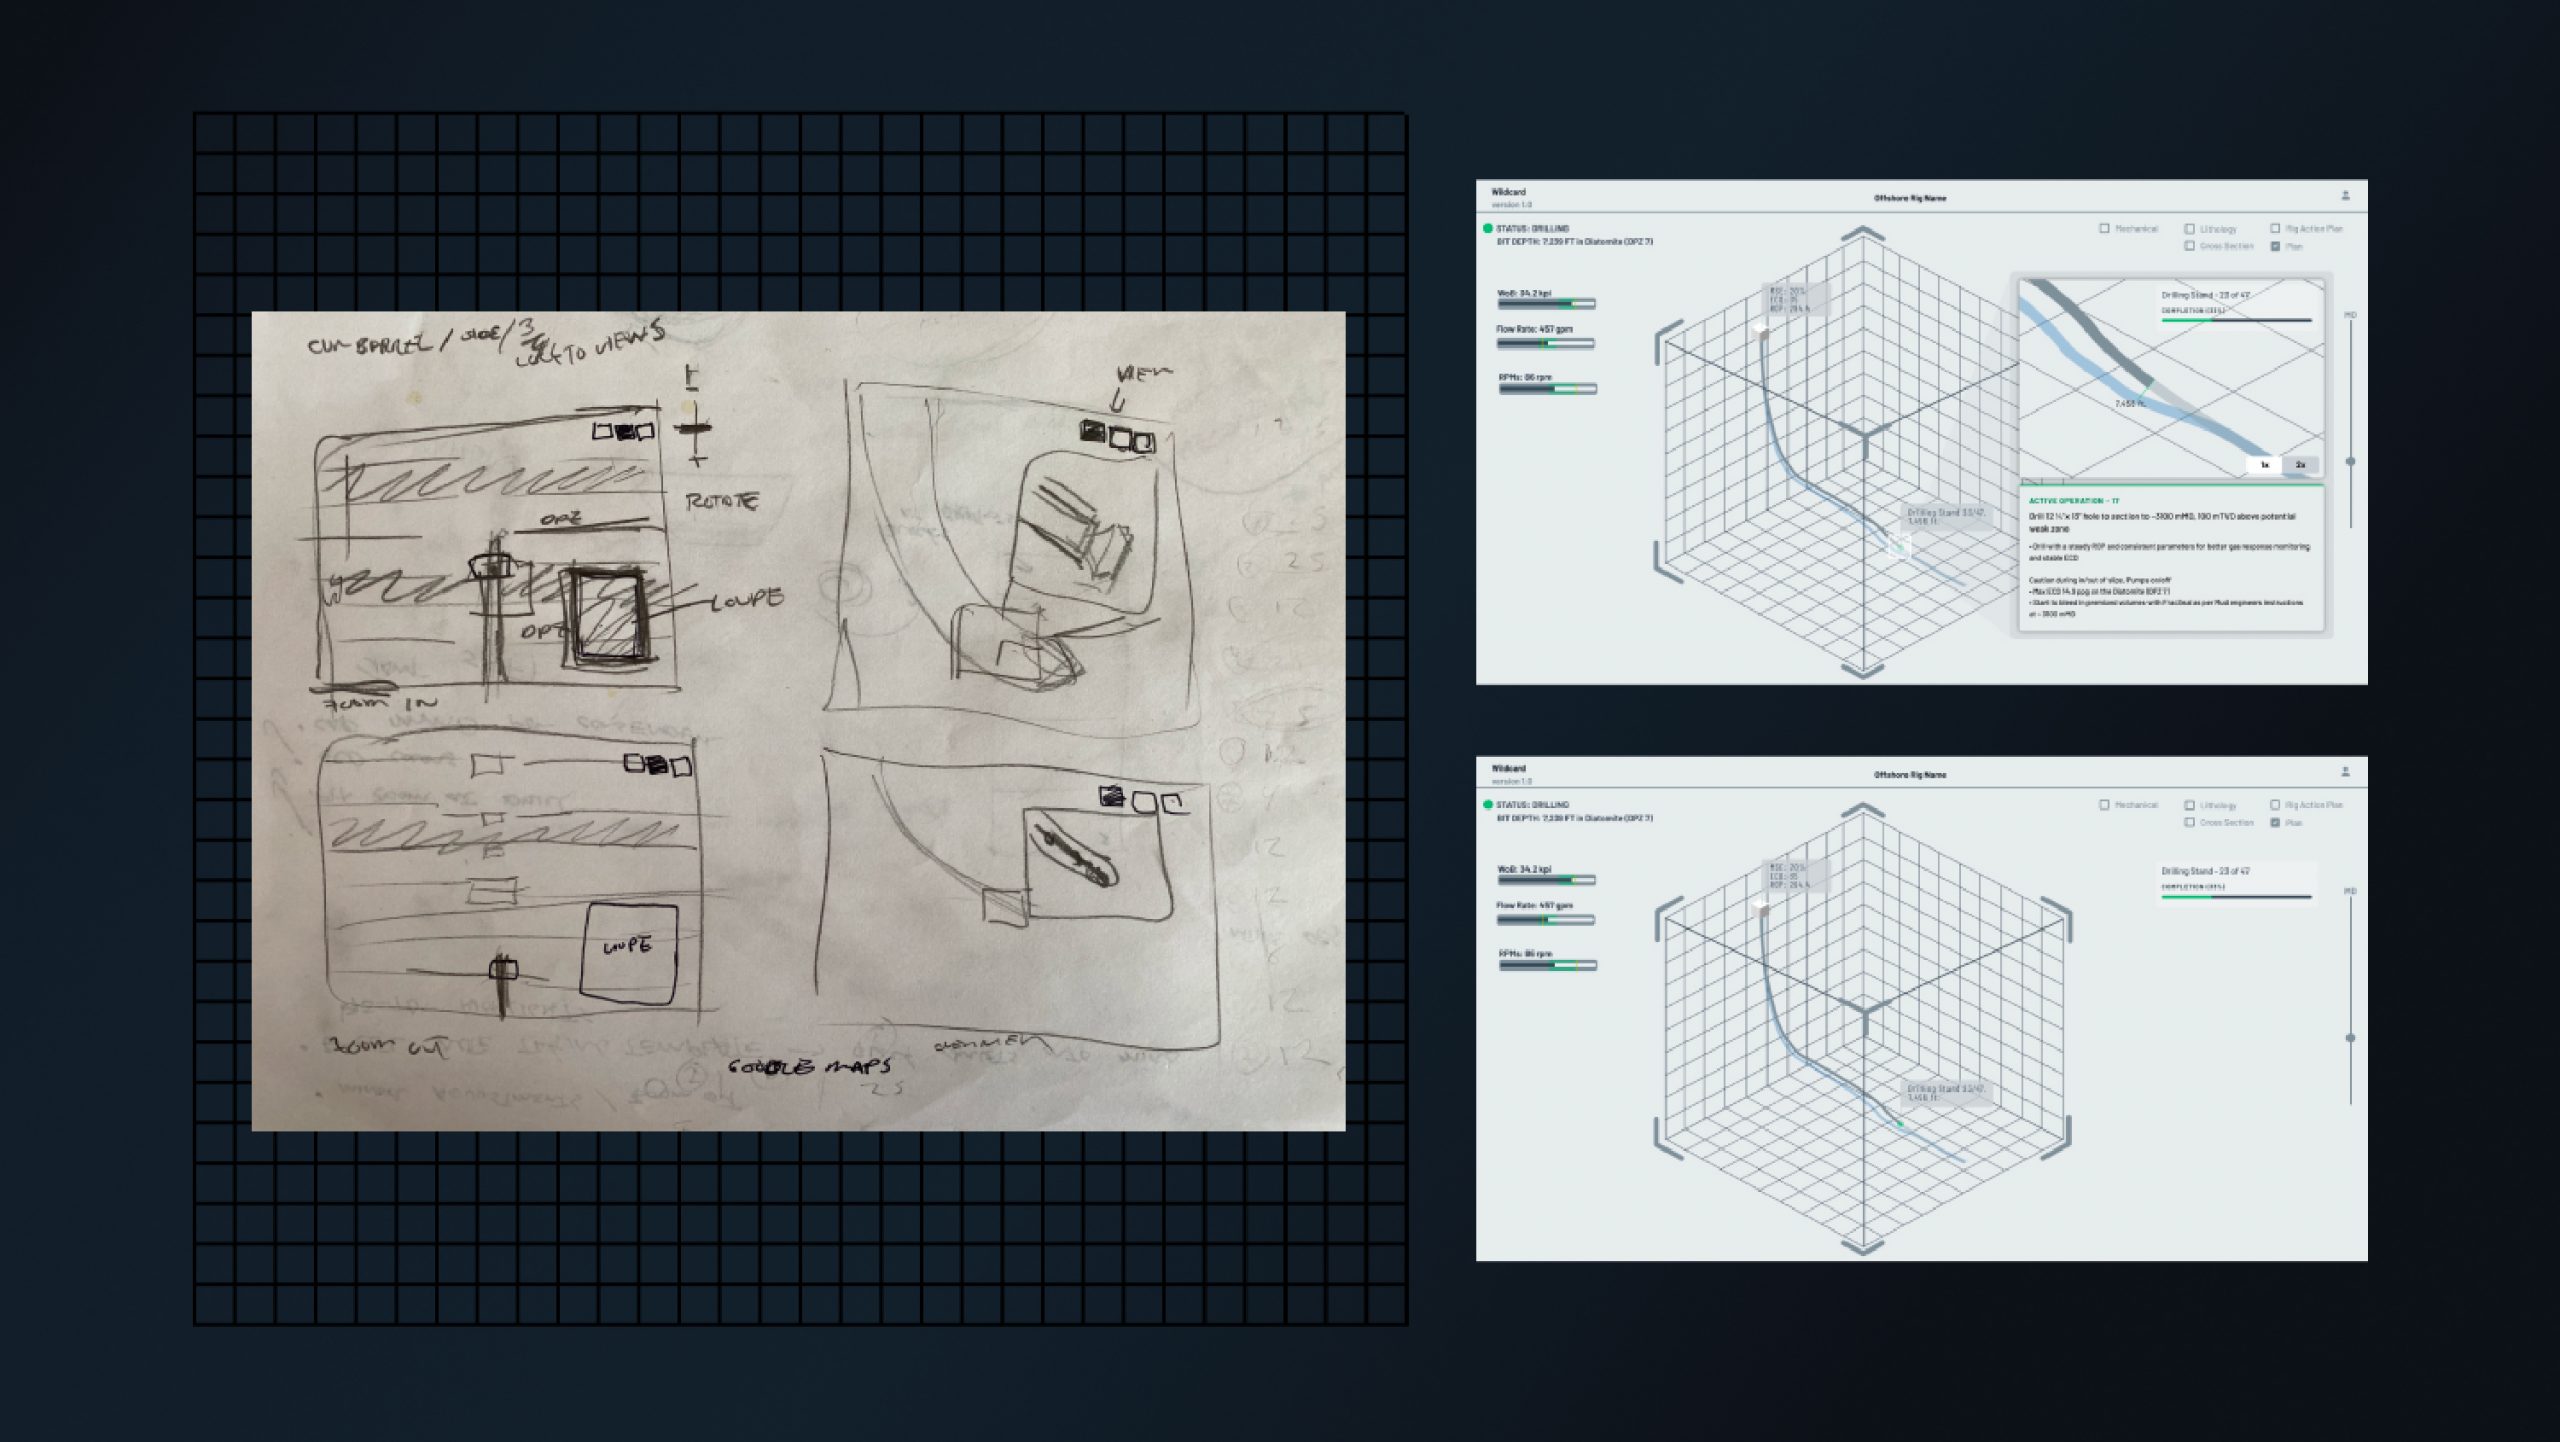
Shift handover process flow
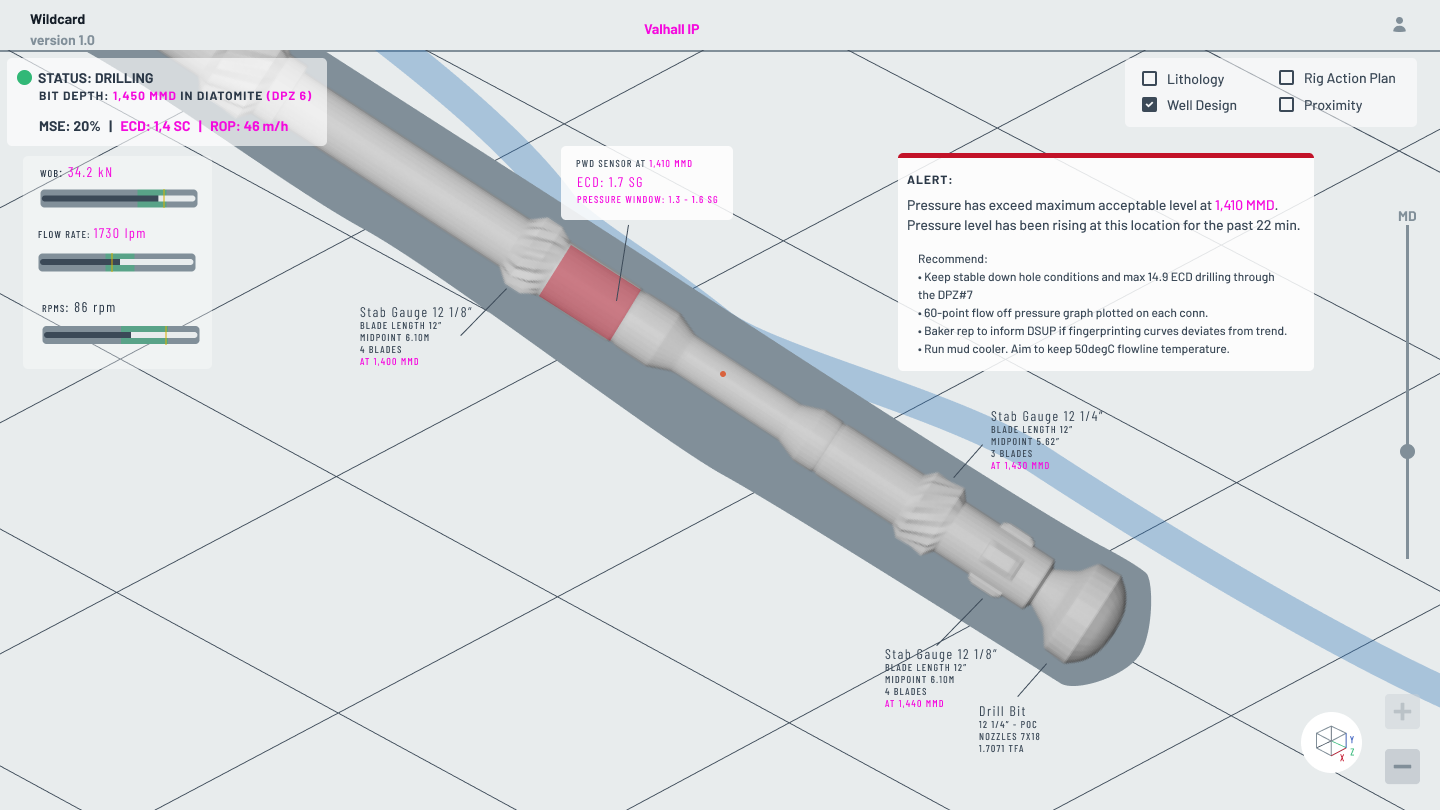
Initial the view of Isometric Loupe by gathering information from the split view before.

week 7
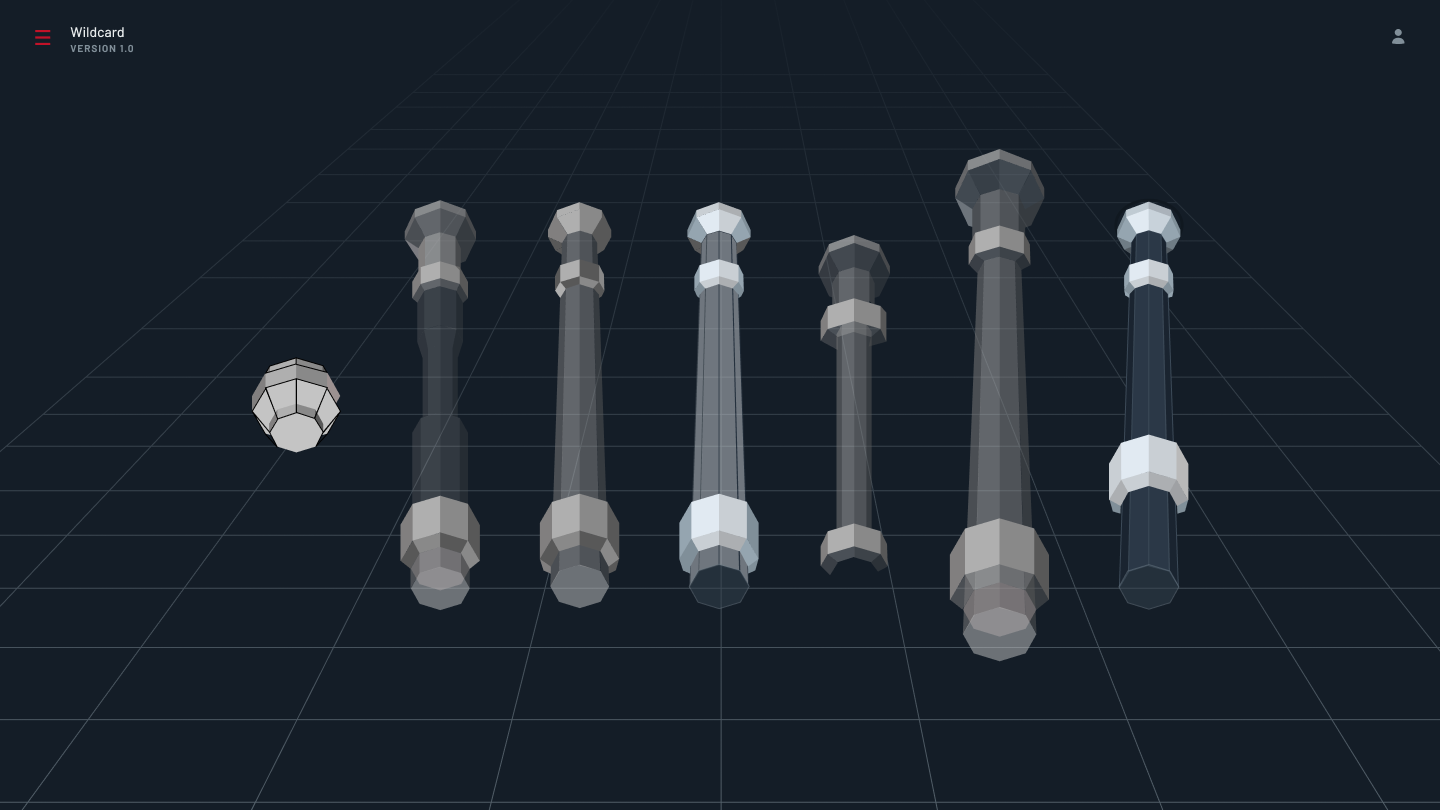
Optimize Models and Integration
- Strike a balance: Reduce model complexity where possible without compromising visual clarity or essential information.
- Apply level-of-detail (LOD) techniques: Dynamically adjust model detail based on viewing distance and user interaction to optimize performance.
- Consider geometric simplification: Reduce polygon count and simplify shapes for less visually critical elements.
- Utilize texture optimization: Employ appropriate texture compression formats and sizes for efficient rendering.
- Explore procedural techniques: Generate details like textures or geometry procedurally when required, reducing model size and memory usage.
week 8-9-10
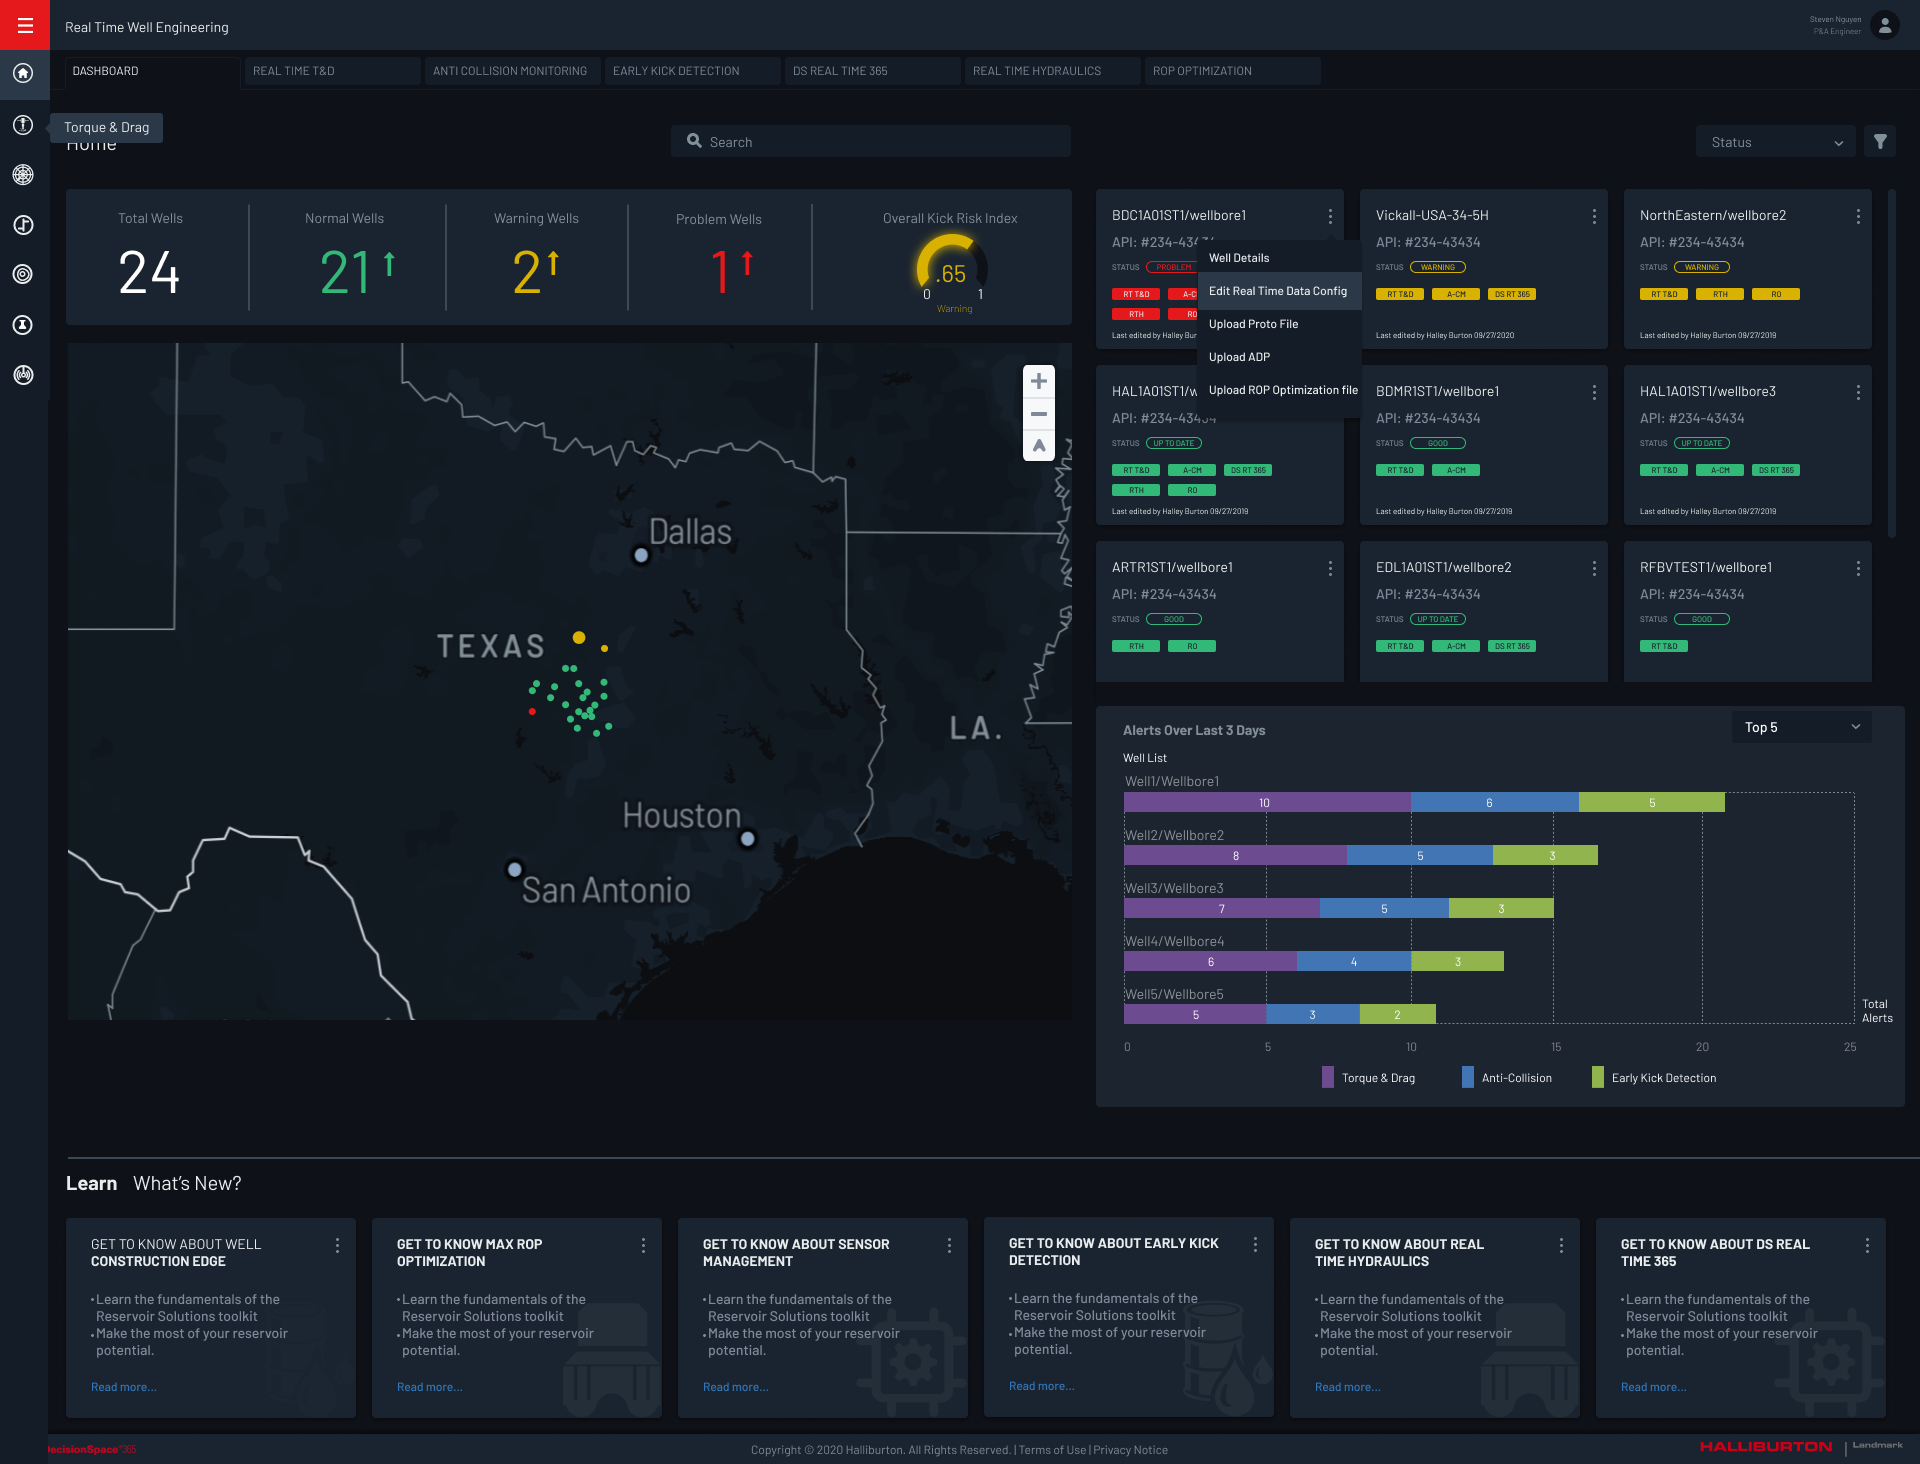
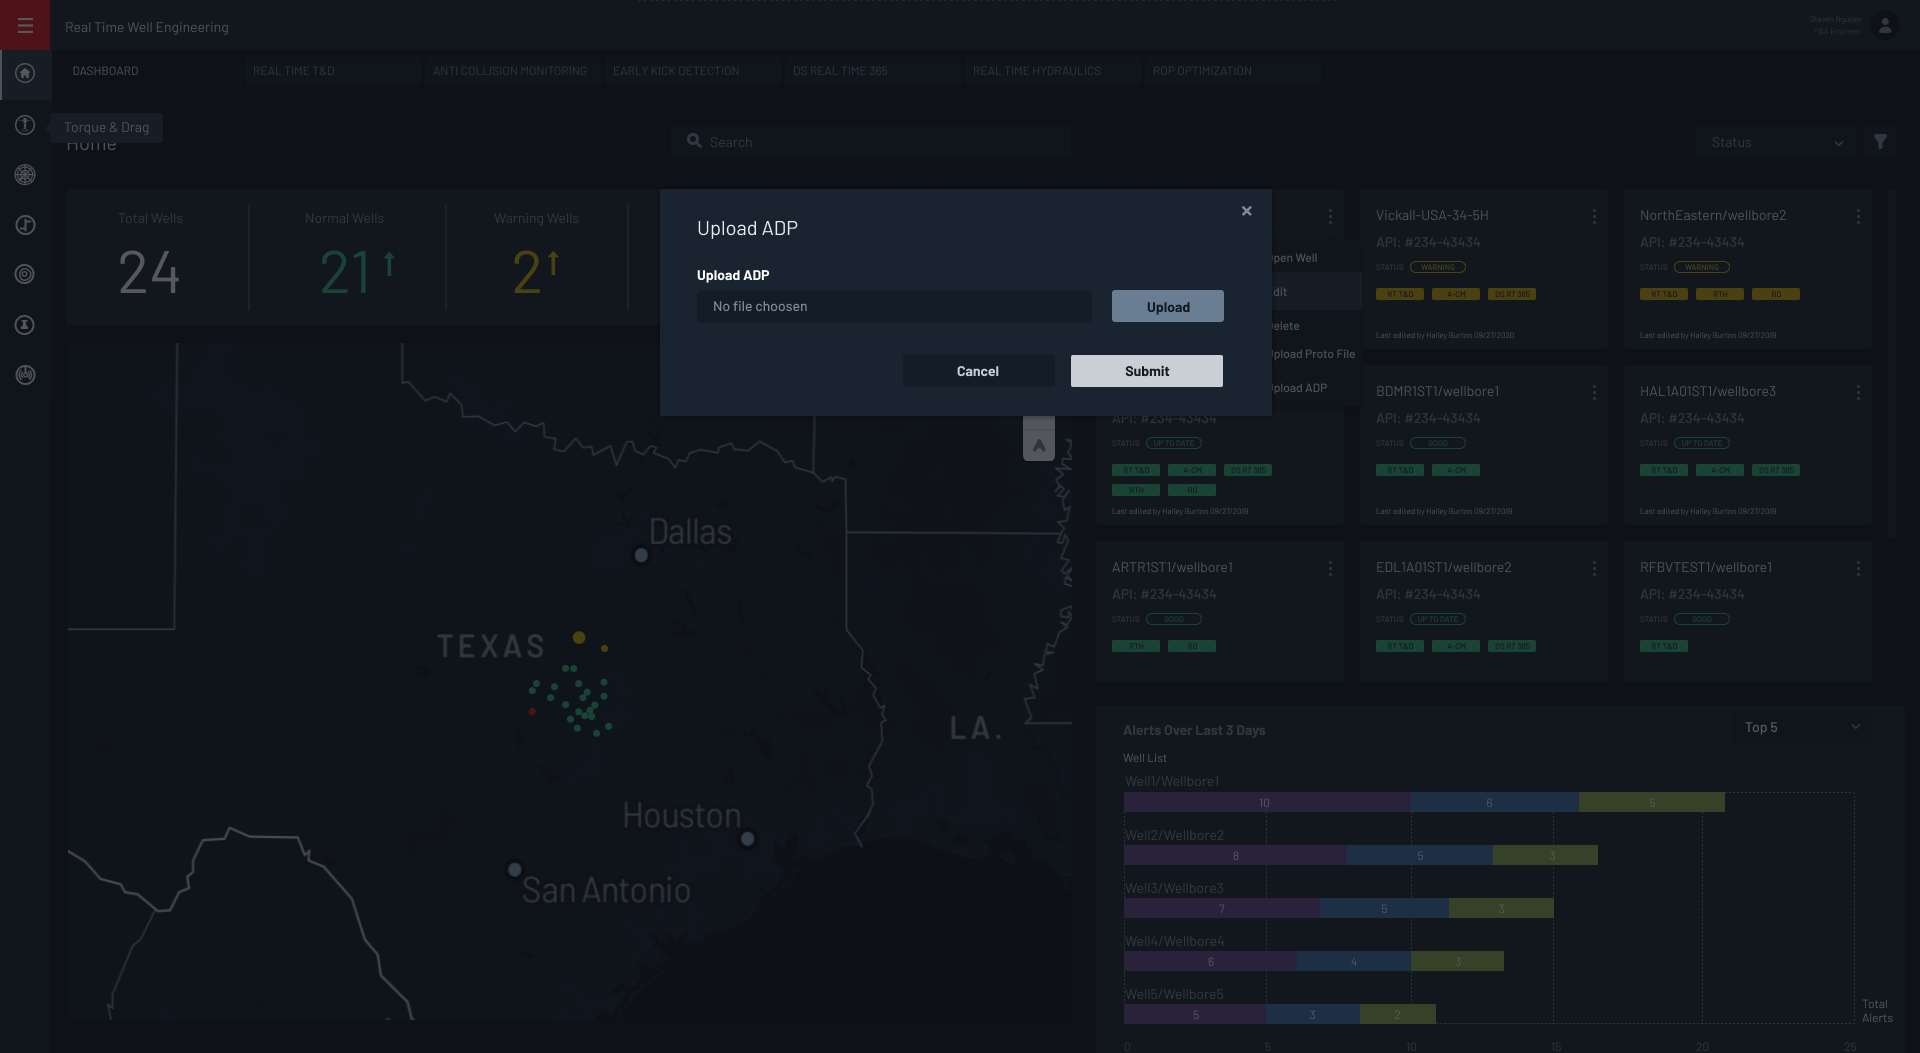
Comprehensive approach to design Dashboard
-
-
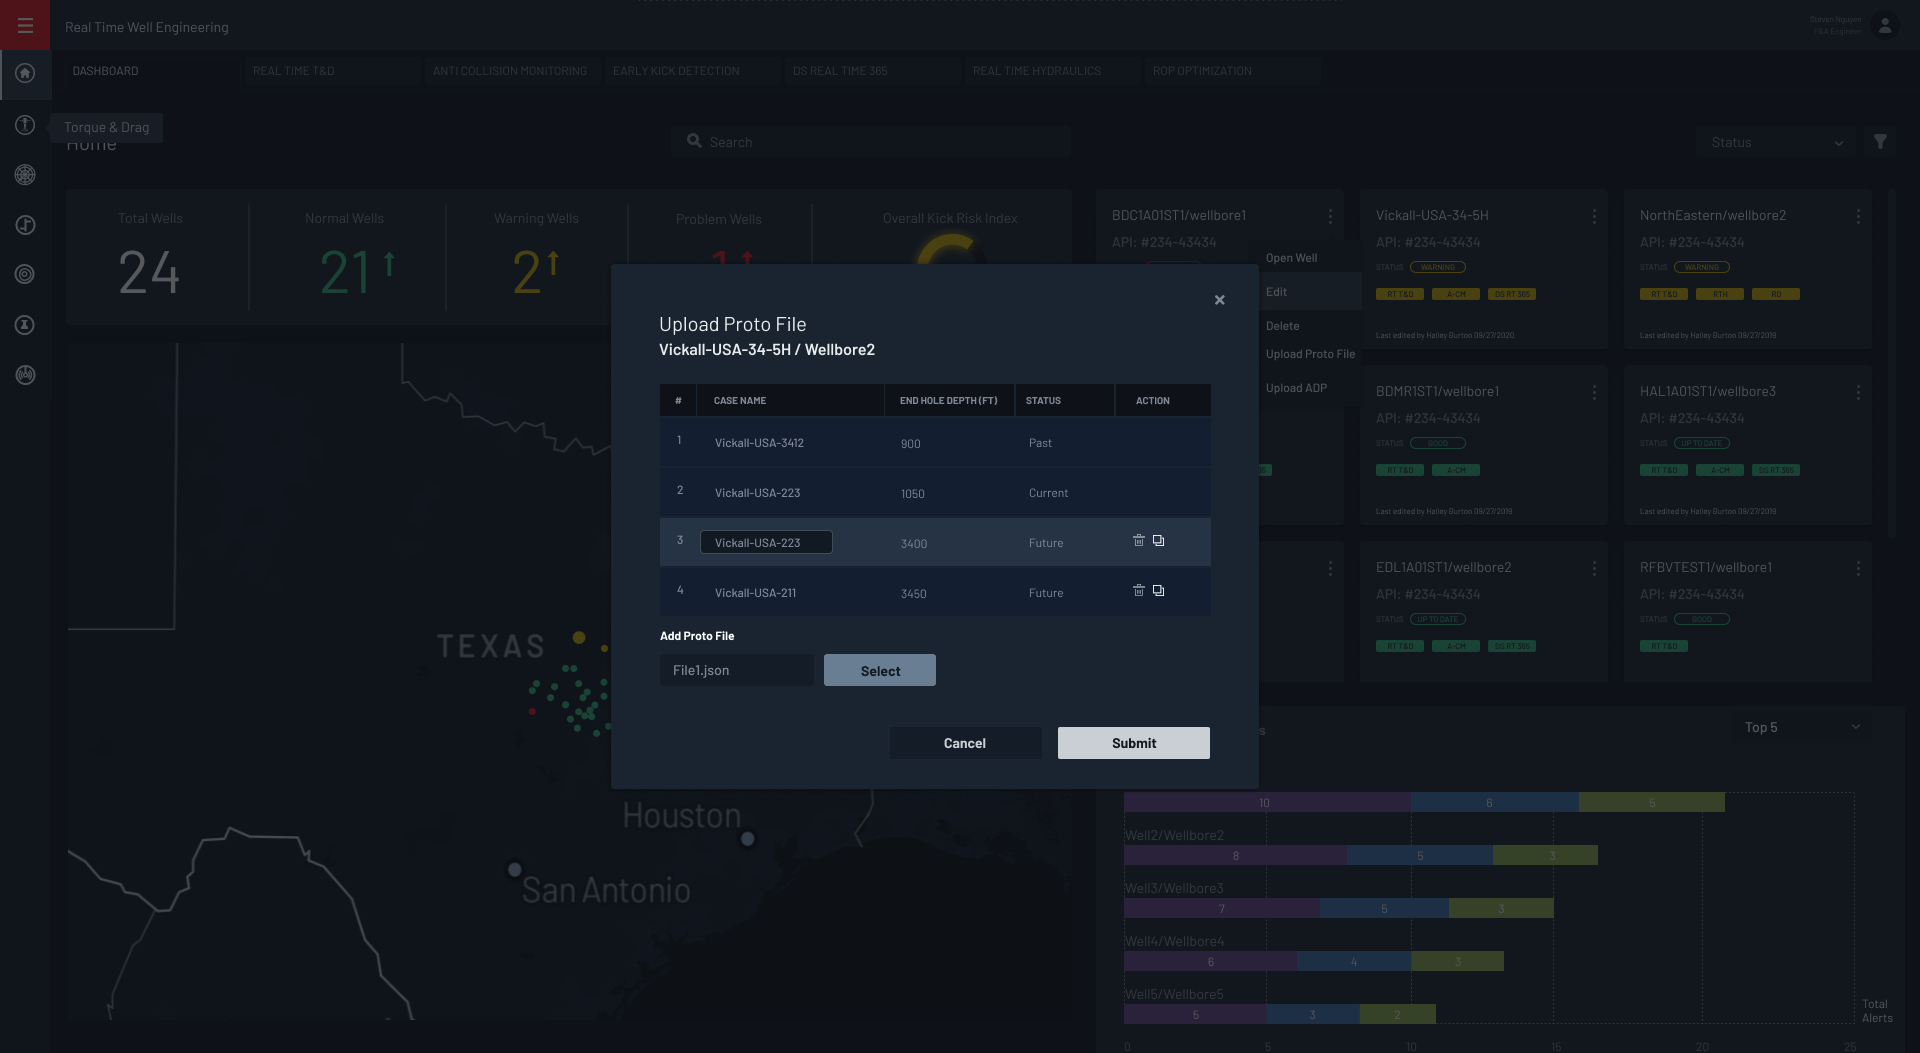
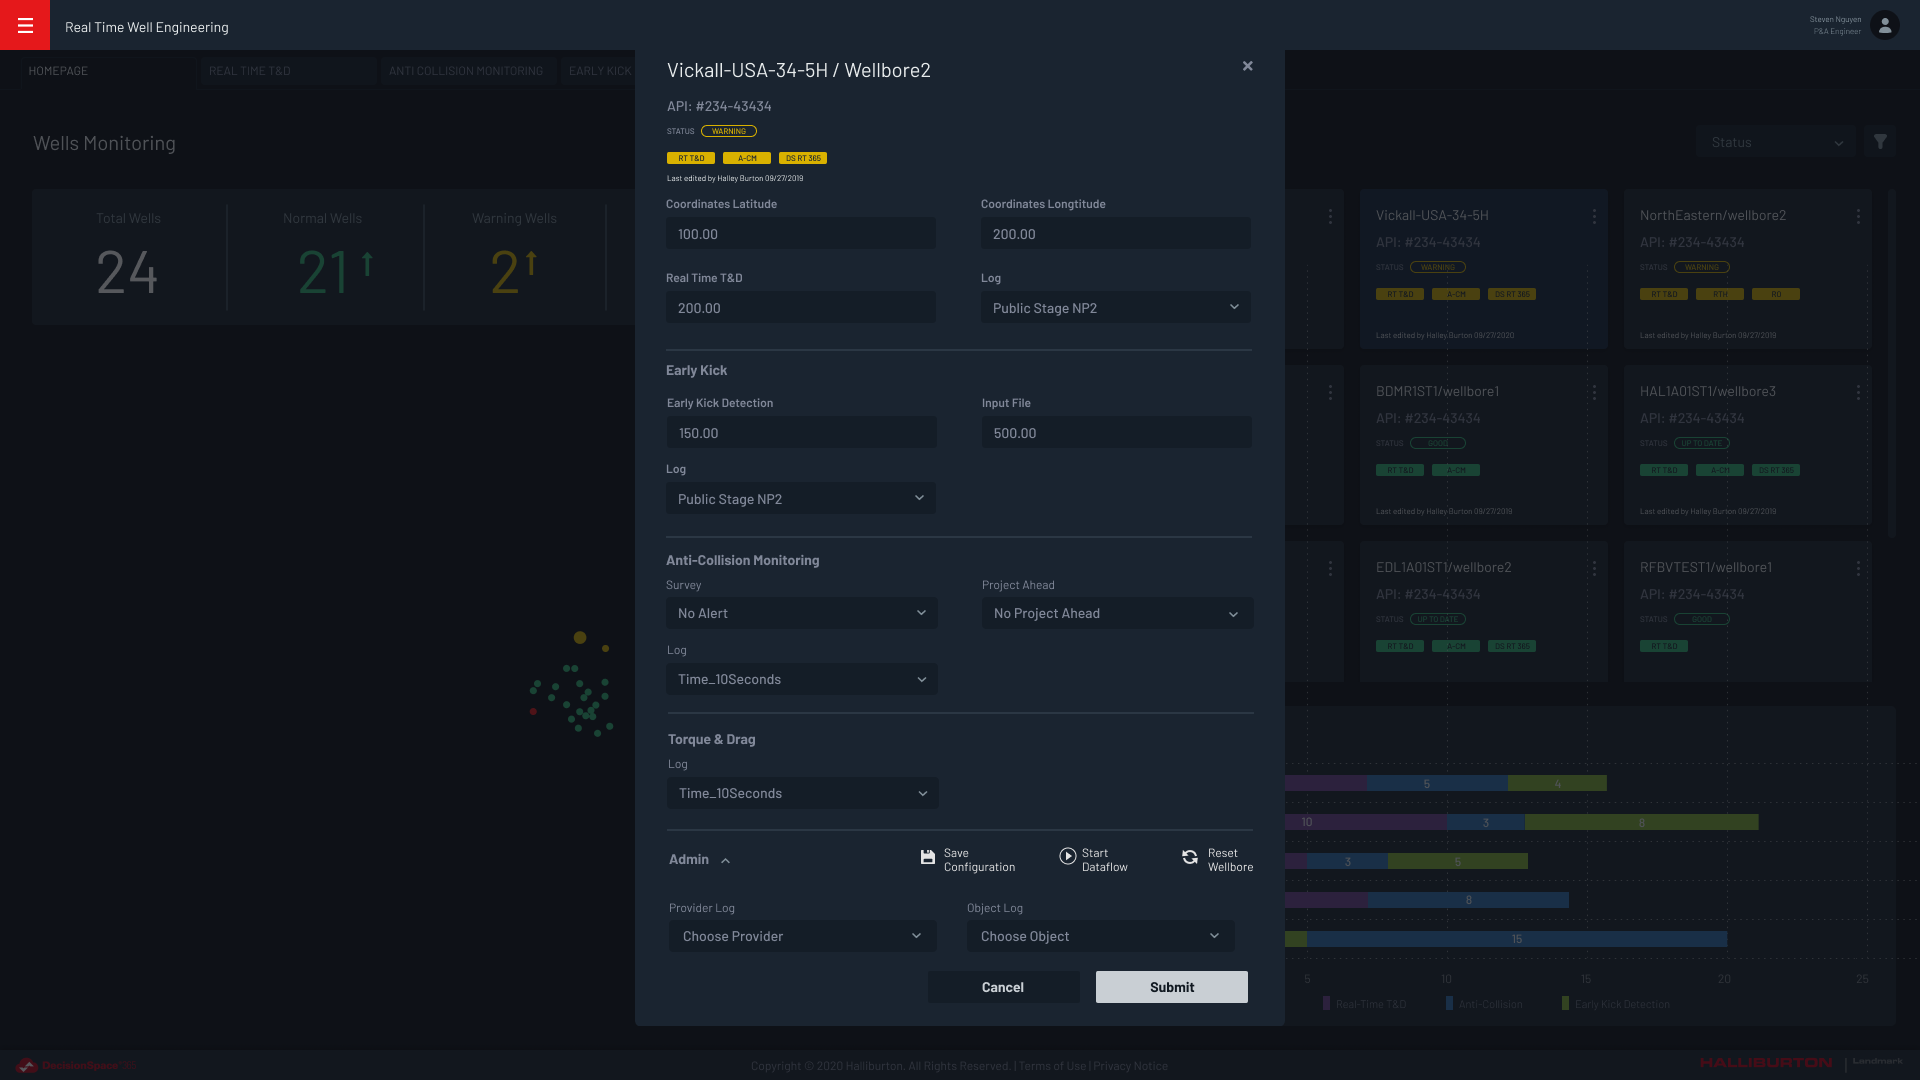
Home Dashboard:
- Focus on critical data: Prioritize real-time drilling parameters, sensor readings, and key performance indicators (KPIs) relevant to each user role.
- Organize data logically: Group related data points into meaningful categories and subcategories for easy navigation.
- Utilize visual cues: Employ color-coding, size variations, and other visual elements to highlight critical information and anomalies.
-
week 8-9-10
-
-
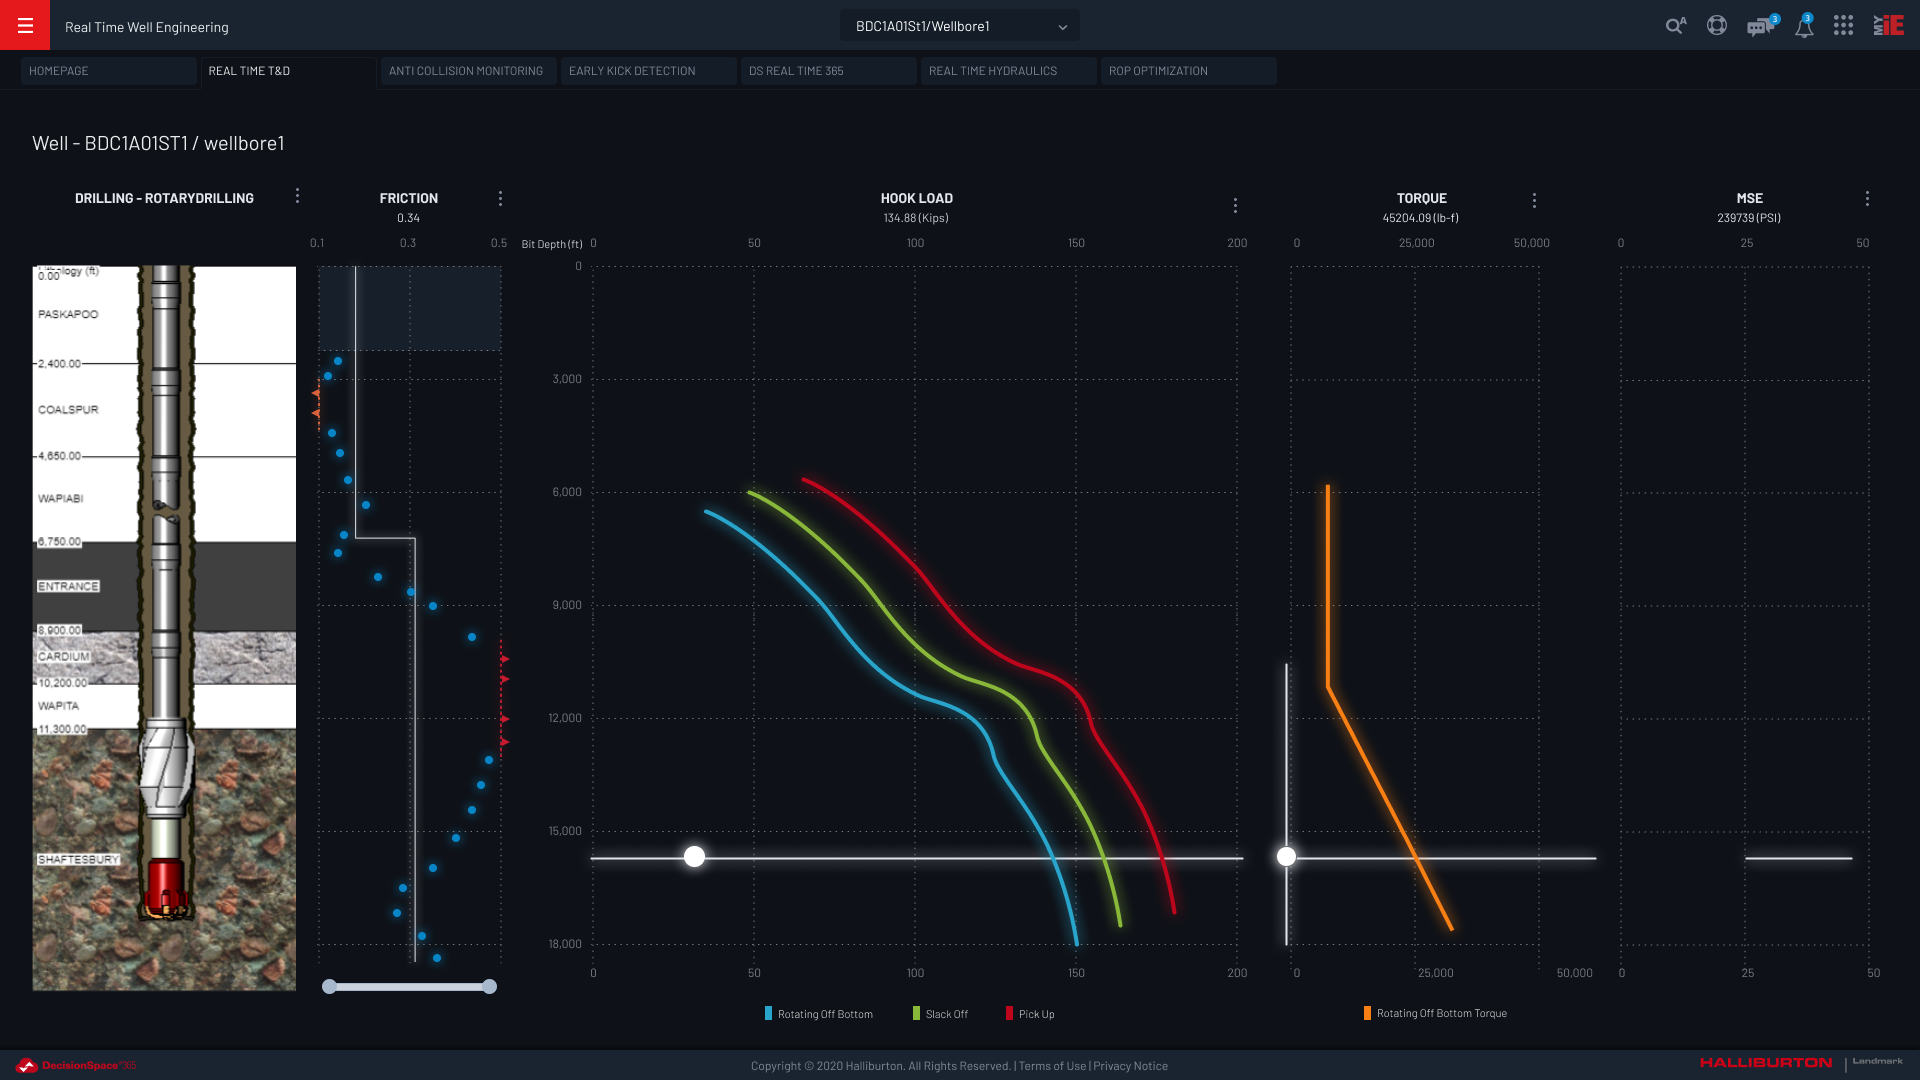
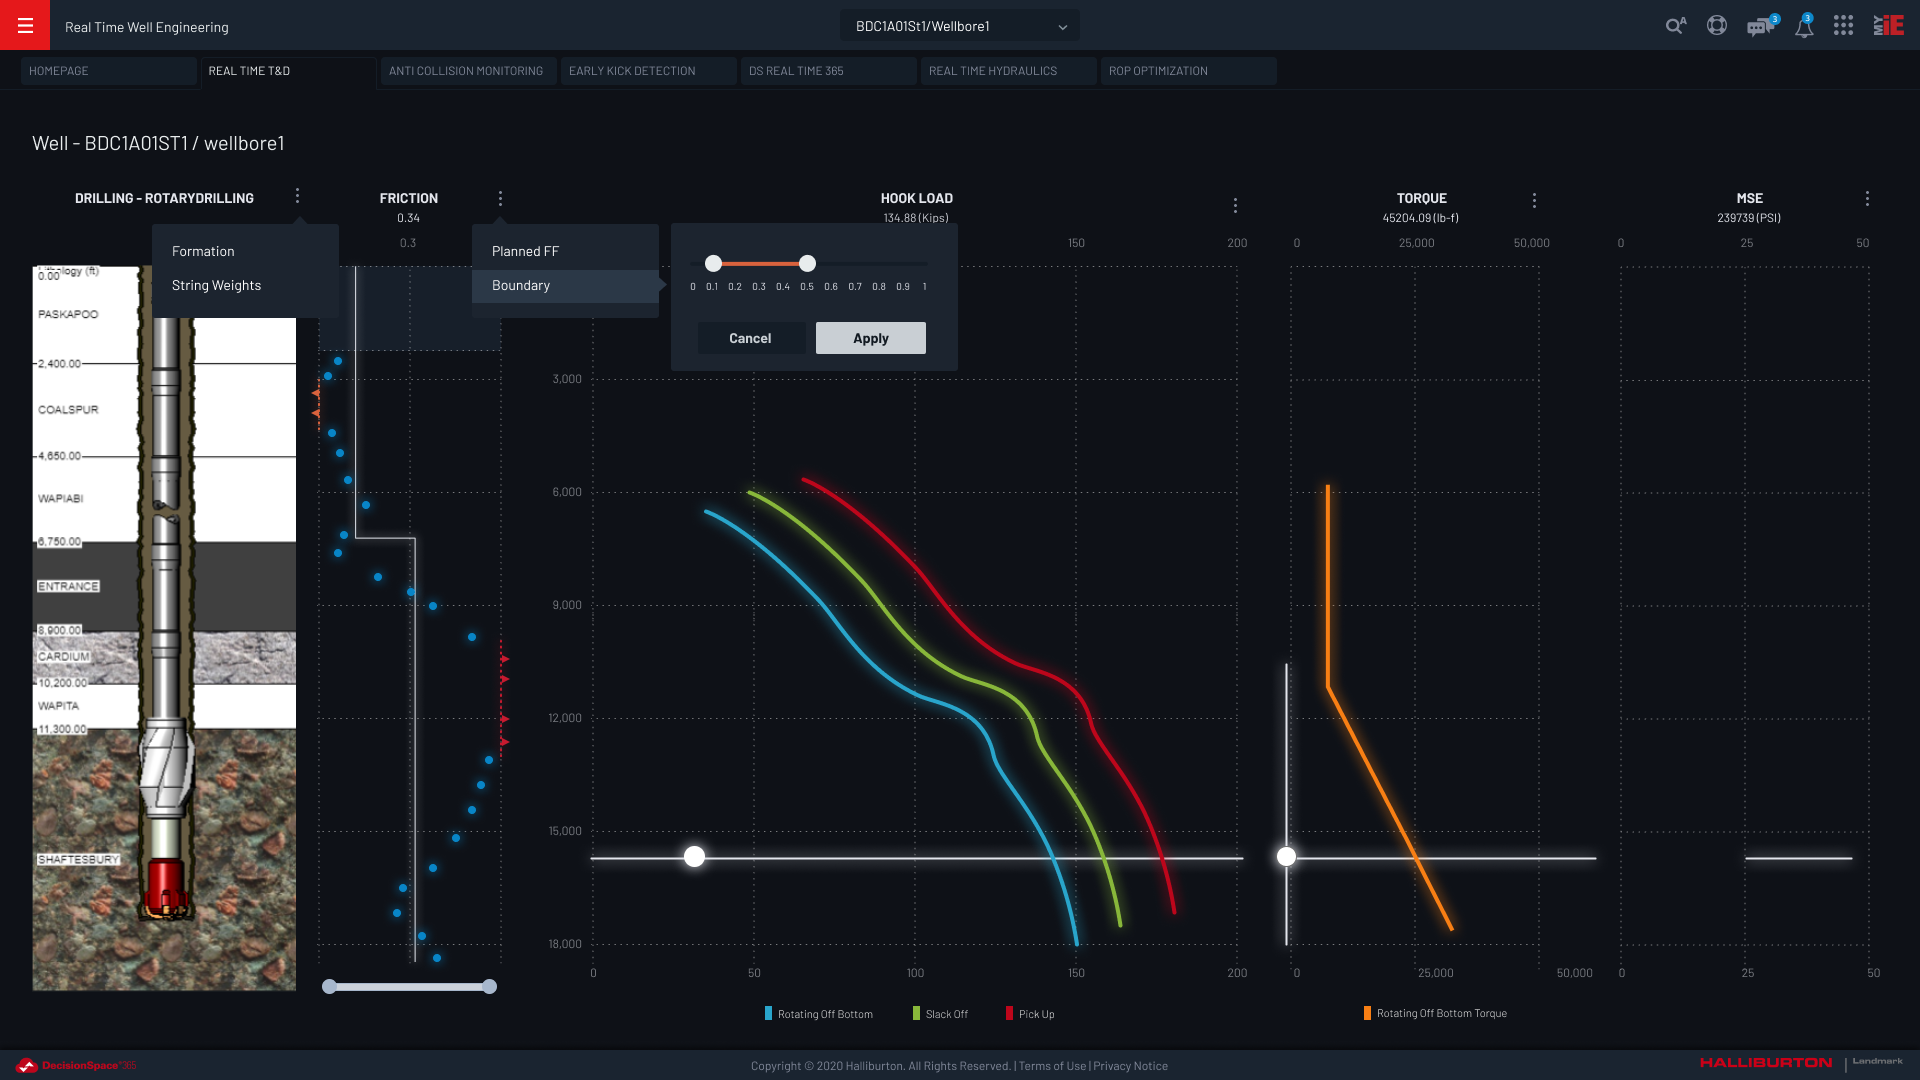
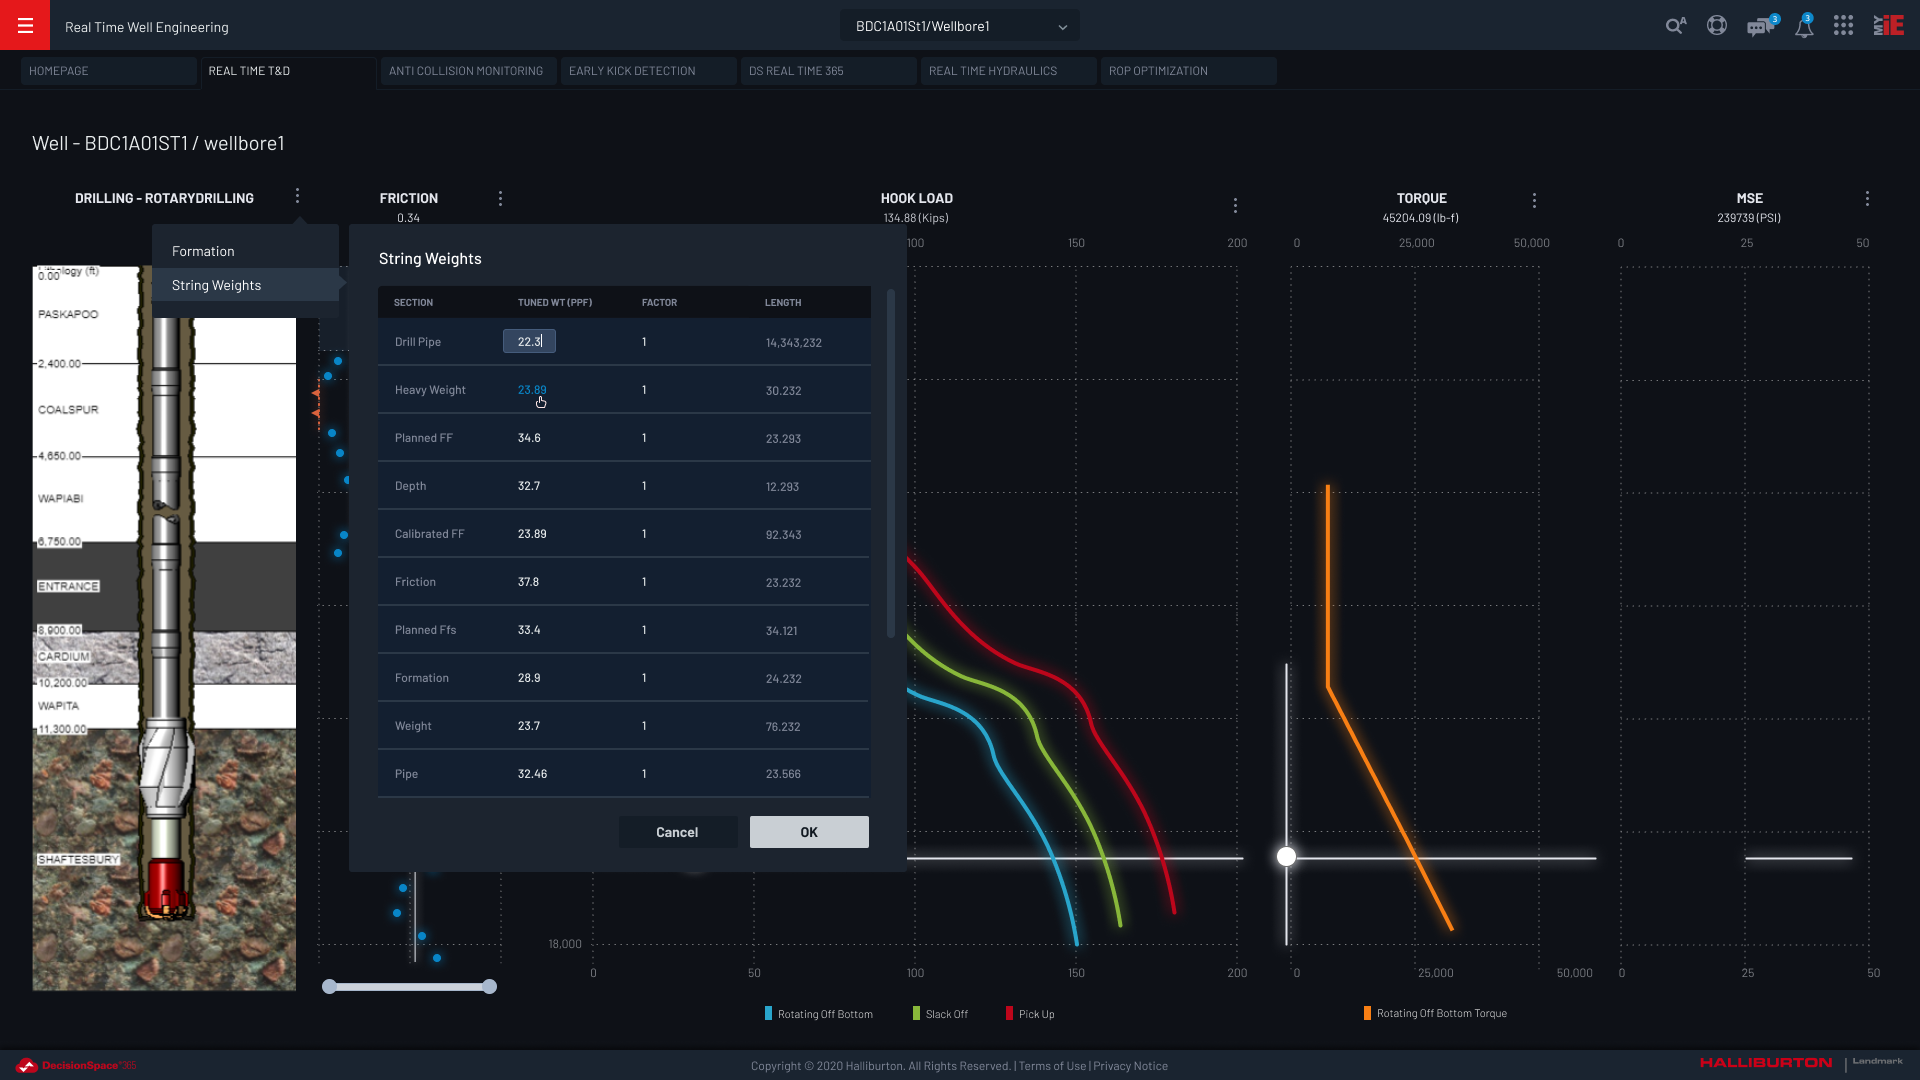
Realtime T&D:
- Clear and concise visuals: Use charts, graphs, and gauges that are easy to understand at a glance, even for users with limited data visualization experience.
- Interactive elements: Allow users to filter, zoom, and customize the data displayed on the dashboard for deeper exploration.
- Modular and flexible layout: Design a modular layout with customizable panels that users can arrange and resize to suit their preferences.
- 3D integration: Consider integrating relevant 3D wellbore visualizations seamlessly with the dashboard for holistic situational awareness.
-
week 8-9-10
-
-
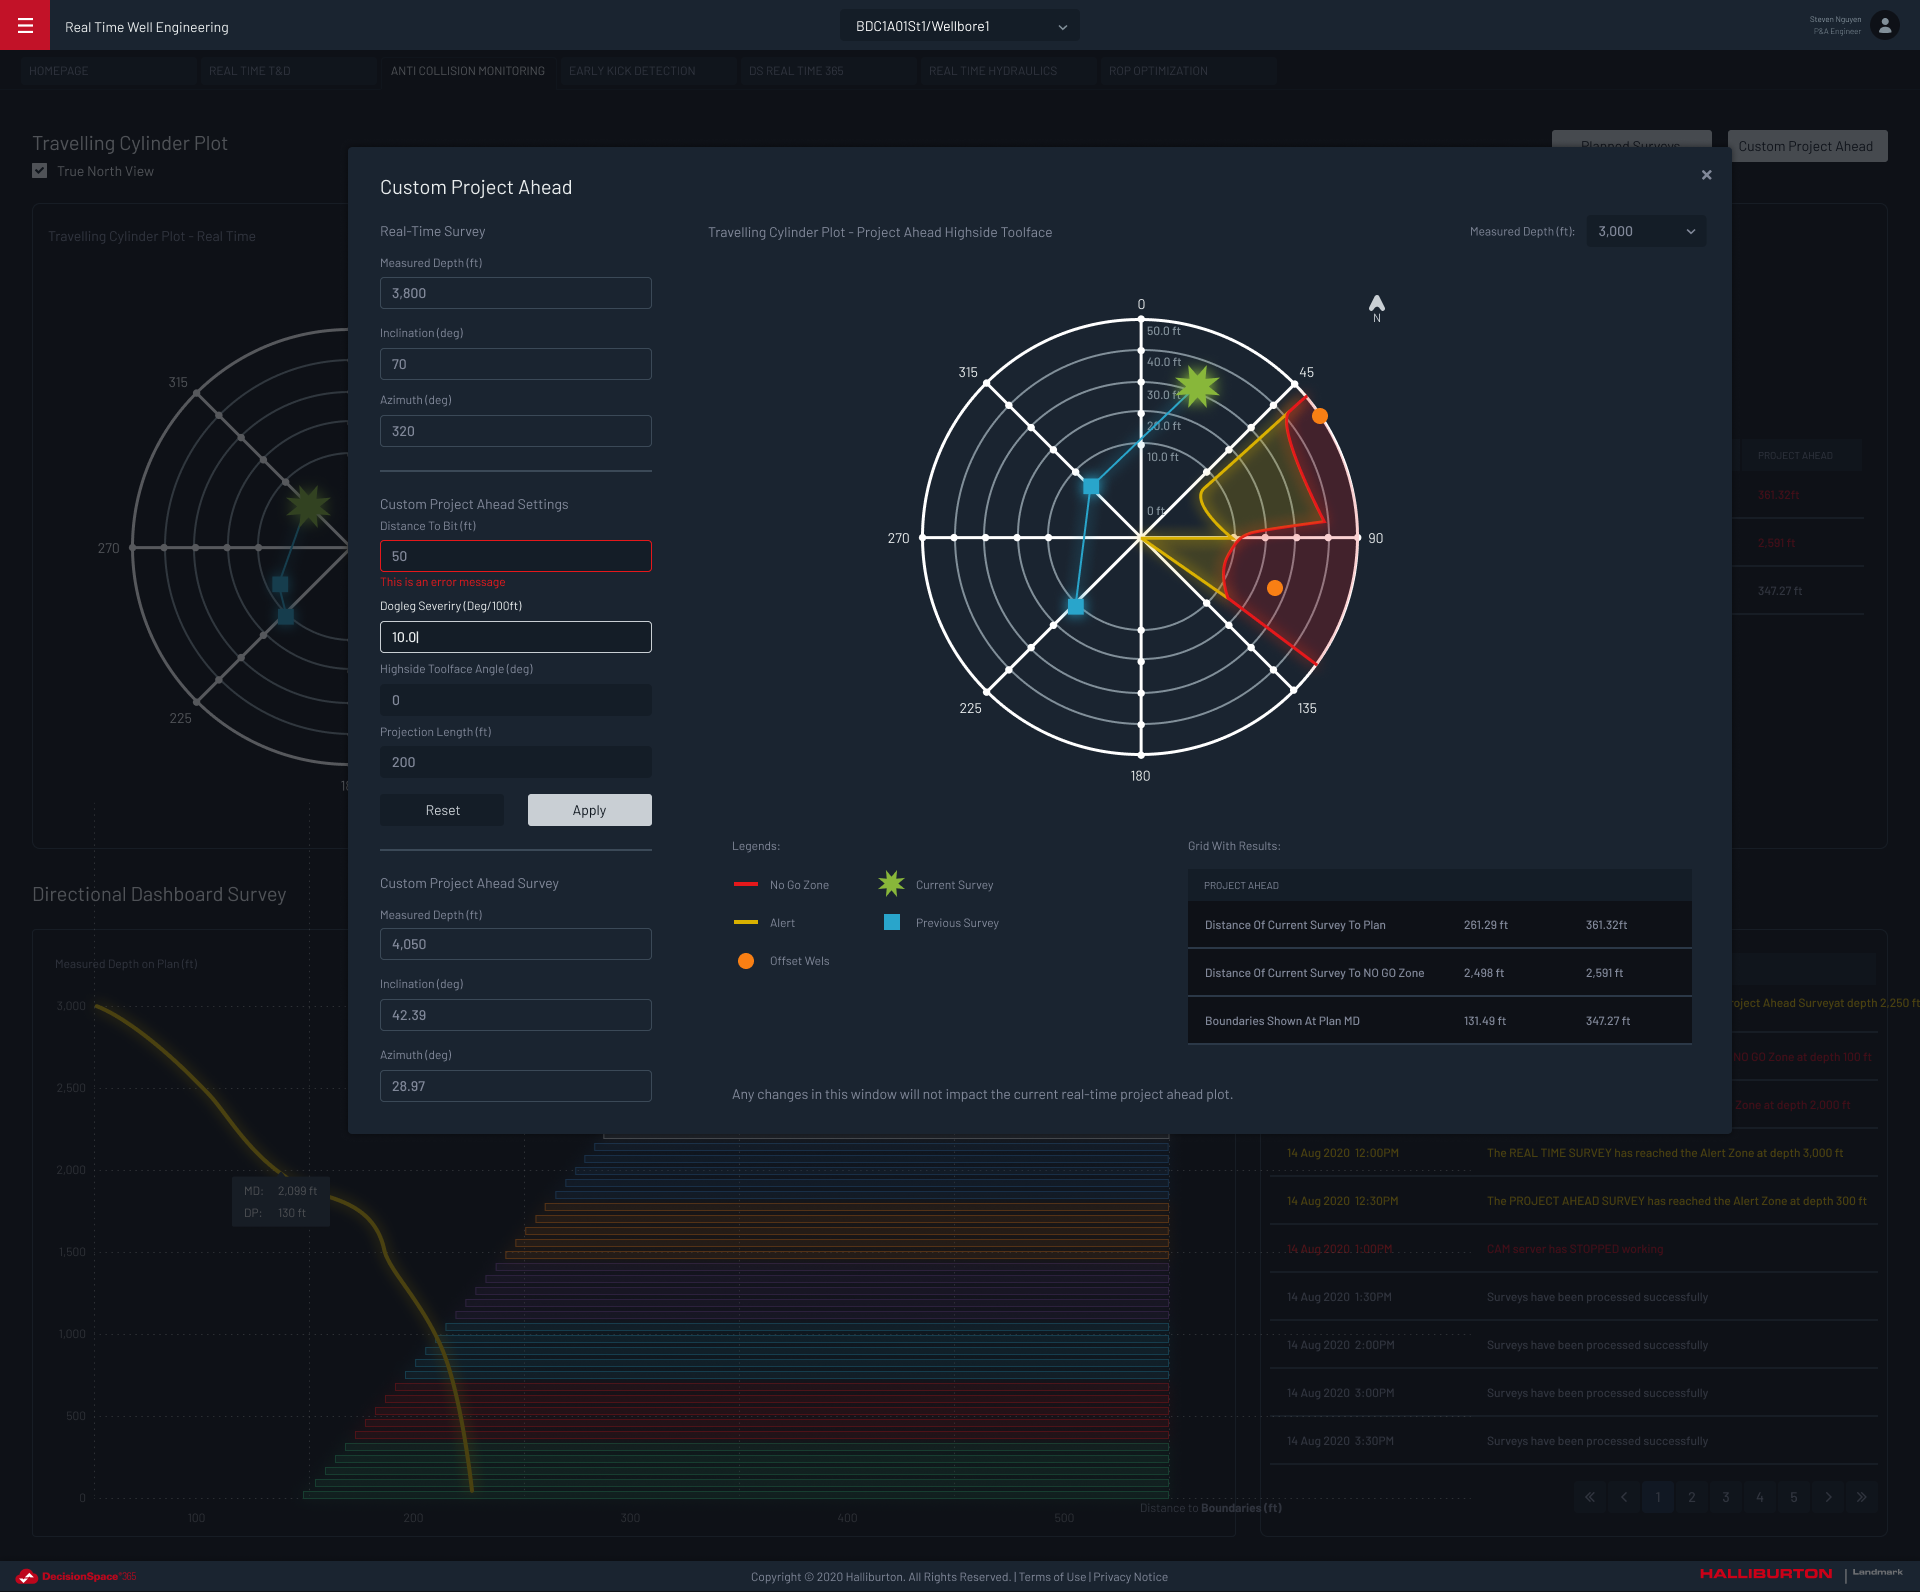
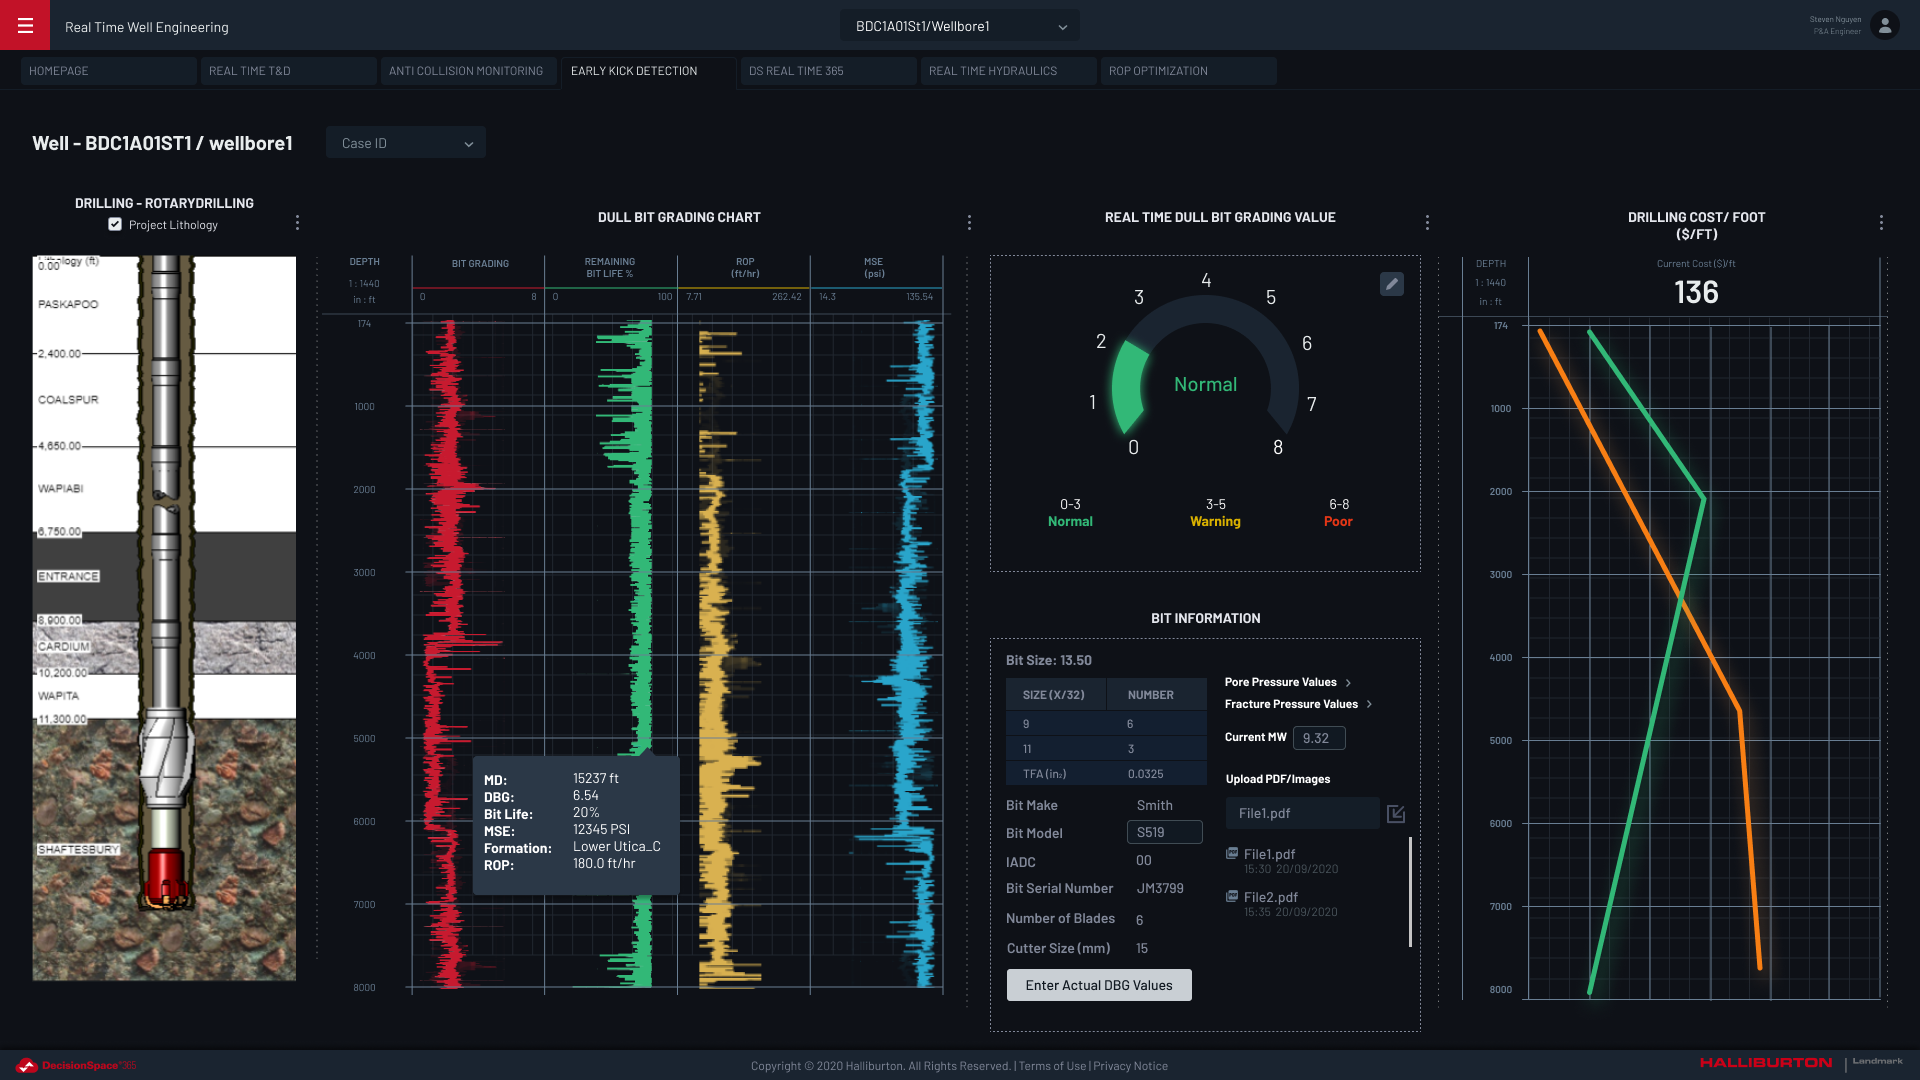
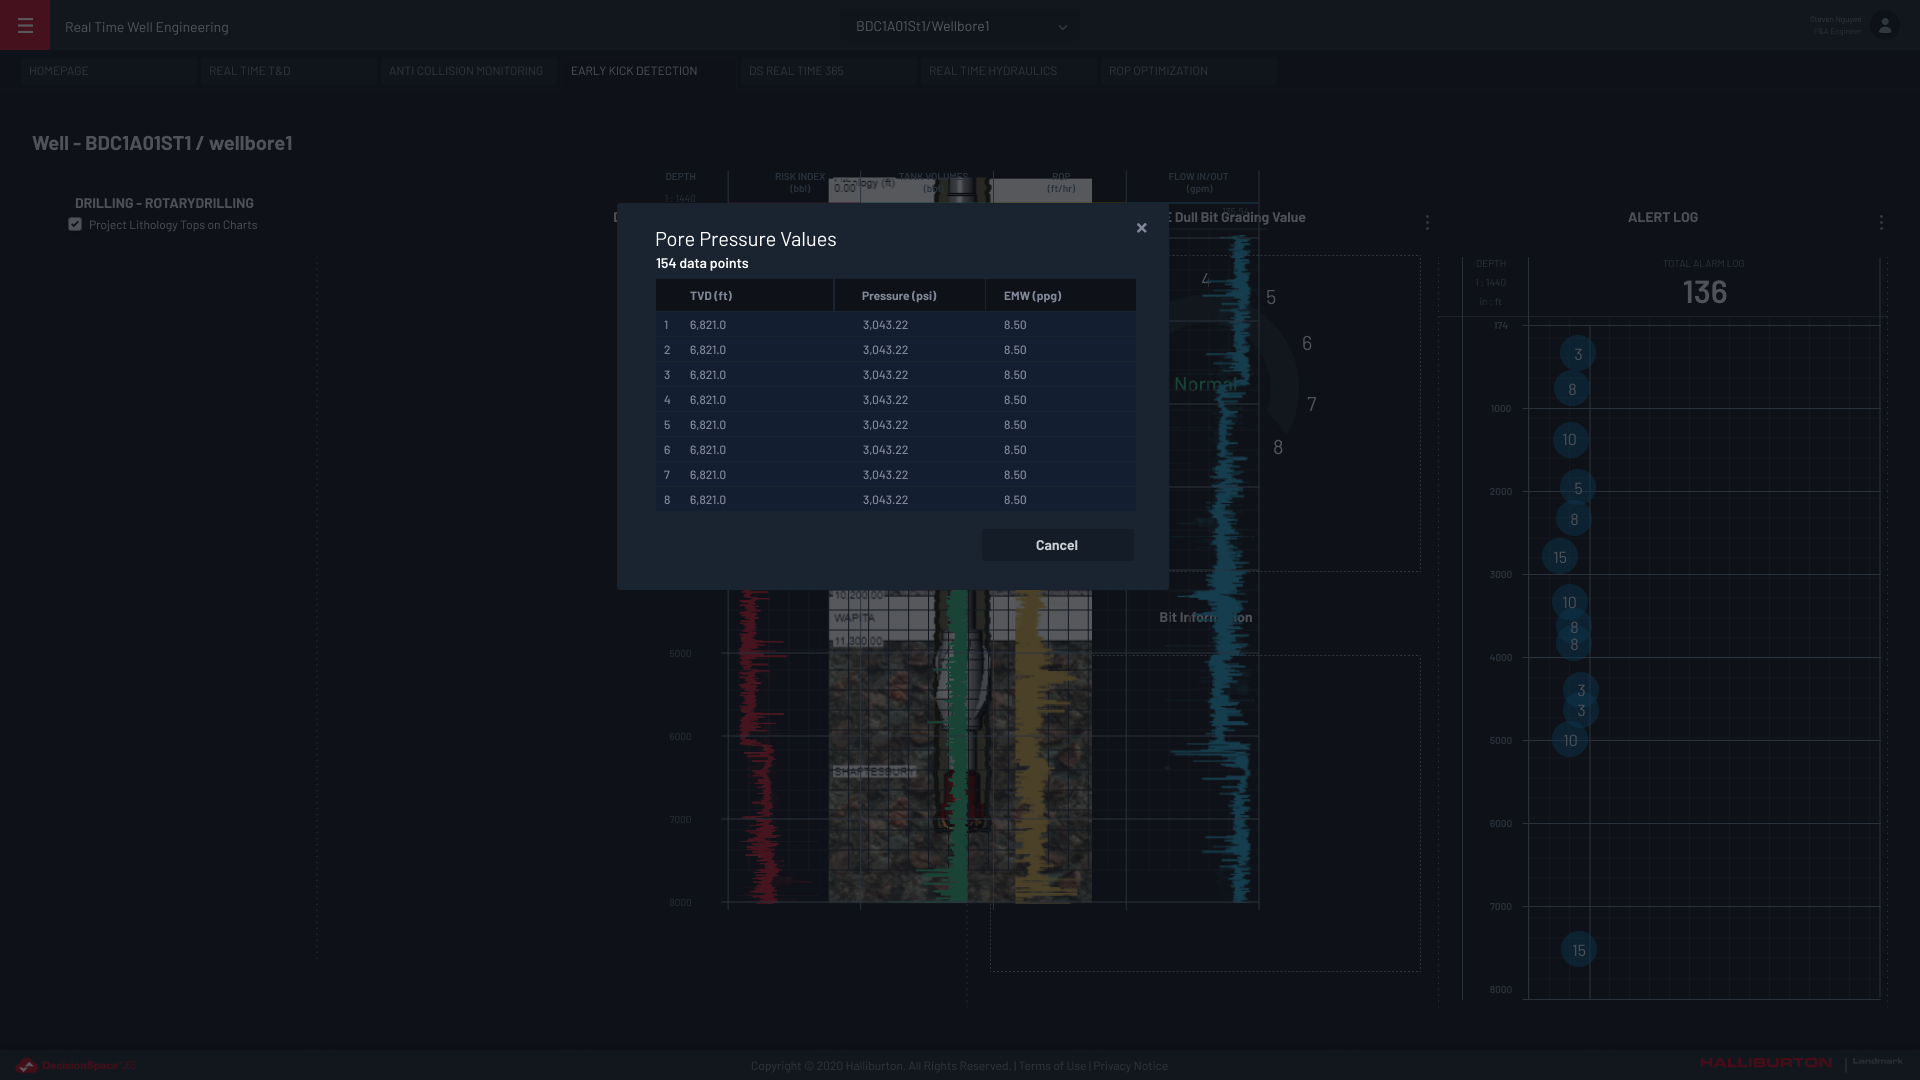
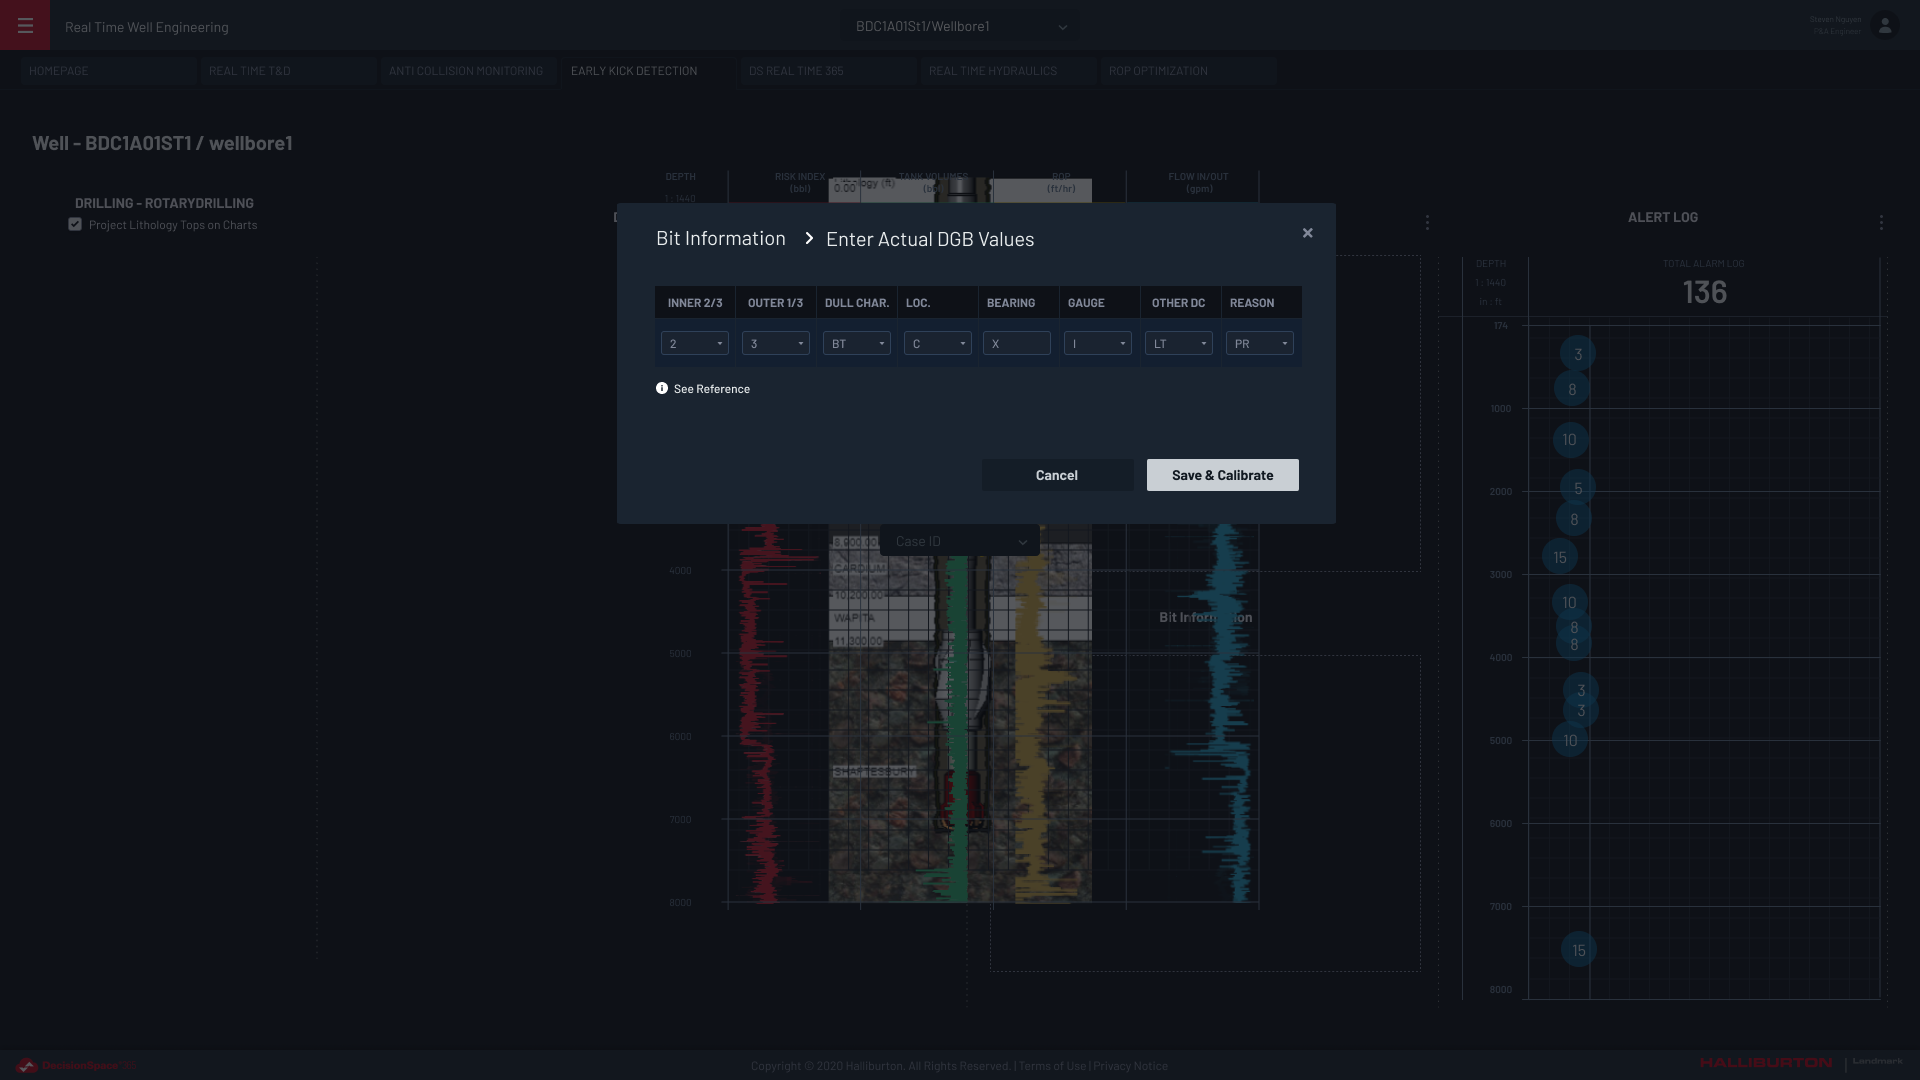
Anti Collistion and Bit Grading:
- Automated visualizations: Automatically update charts and graphs based on real-time data and set thresholds for triggering alerts.
- Customizable alerts: Allow users to define personalized alert conditions for critical events or parameter deviations.
- Time-based comparisons: Enable historical data comparisons to analyze trends and identify potential issues.
-
Hypothetical data metrics
Track UI/UX effectiveness
- Time to identify critical events
- Decision-making accuracy
- Drilling time reduction
- Team communication frequency
- Safety incident rate
- User satisfaction surveys
- Eye-tracking data